

Author: Roshan Shah
Mentor: Dr. Zachary Michaelson
Glenbrook South High School
Abstract
I evaluate a technical trading strategy that combines the Relative Strength Index (RSI) with a moving‑average (MA) trend filter. Using daily data for the 30 Dow Jones Industrial Average (DJIA) constituents over July 18, 2015–July 18, 2025, I test RSI deviation thresholds of 10, 15, and 20 points from neutral and apply a quarterly walk‑forward selection of RSI and SMA lookbacks. Returns are computed with next‑day execution and later adjusted for transaction and borrow costs. Across all specifications, Sharpe ratios are not statistically different from zero at the 5% level, and realistic costs eliminate small gross gains. Return distributions display high excess kurtosis and low skewness, consistent with exposure to higher‑order risks. I interpret the RSI and SMA combination less as a price‑forecasting tool and more as a risk filter that concentrates tail exposure. The strategy underperforms unconditionally, but the profile suggests it could perform better in specific market regimes in which such risks are compensated. I discuss implications for market efficiency and for using technical rules to target or avoid priced co‑moment exposures.
1. Introduction
Can a double-signal technical trading strategy generate consistent, risk-adjusted returns over the past decade?
To answer this, I run a 10-year backtest on three RSI deviation thresholds (10, 15, and 20 points from neutral), each paired with MA-based trend confirmation. Performance is measured gross of transaction costs and then adjusted using basis-point cost scenarios. I compute risk-adjusted metrics, including Sharpe ratios with Newey-West standard errors, Calmar ratios, and Sortino ratios, for each variation.
Multiple trading influencers promote variations of the RSI and MA strategy as a ‘magic bullet’. These influencers and channels have large followings and often promote their strategy in tandem with a course or funded trading partnership. Some examples are The Moving Average (YouTube, 1.07M+ subscribers), Trading Lab (YouTube, 1.74M+ subscribers), LuxAlgo (TikTok, Instagram, YouTube, 1.2M+ total followers), and many others. They create videos with bright, attention-grabbing colors and enticing thumbnail covers that draw inexperienced audiences in, promising to teach the “right way” to use these indicators and generate unrealistic returns. While these videos focus on anecdotal success and visual appeal, this study tests the strategy in a systematic, data-driven way.
This paper finds that none of the tested variations deliver statistically significant Sharpe ratios, with 95% confidence intervals spanning zero across all strategies. Some configurations yield small positive gross returns, but realistic transaction costs erase these gains. Our results suggest that this RSI–SMA strategy does not provide persistent predictive power and that any observed profitability likely stems from random variation rather than structural inefficiency.
Many investors employ technical trading strategies, such as the RSI and MA, despite decades of academic skepticism. If markets are efficient and past prices contain no useful information, such strategies should not be effective; yet, they persist in practice. We contribute to the literature by testing a simple yet popular combination of RSI and MA to evaluate risk-adjusted performance and exposure to certain risk profiles.
We focus not only on whether this strategy performs well, but also on whether any consistent performance challenges the Efficient Market Hypothesis (EMH), which states that past price data should not offer predictive advantages. McInish & Puglisi (1980) find that markets are efficient through runs tests of utility-preferred stocks. Brock, Lakonishok, and LeBaron (1992), however, find profitability in technical trading rules through nearly a century of DJIA data and contradict the EMH. This conflict shows how empirical results vary based on methodology, asset class, and time horizon, creating a rift between academic theory and real-world trading behavior. Understanding whether this tension reflects outdated testing methods, behavioral inefficiencies, or changing market dynamics is important for both researchers and investors.
The Relative Strength Index identifies overbought and oversold conditions, while the moving average smooths price action to show trend direction. Online trading communities often promote these indicators as part of a ‘signal confluence’ approach before entering trades. As retail trading grows with the rise of zero-commission trading and options contracts, underexperienced traders often rely on signals as primary strategies. These indicators, widely circulated in trading literature and online forums, influence trading decisions despite limited evidence of predictive power, making them a useful case study for examining whether such strategies expose traders to specific market conditions.
In addition to evaluating strategy performance, we reframe technical analysis as a potential filter for hidden risk exposures. This approach considers whether consistent performance could arise from taking on unattractive risks that most investors avoid, and therefore the most rewarding. We account for tail risk and other exposures not well captured in metrics like beta and volatility. In that case, the strategy would not forecast price action but would filter for market conditions where the trade-off between risk and return is most favorable.
The next section reviews the literature on technical analysis, while section three discusses the theoretical context behind risk exposure in asset pricing. Section four describes our methodology, and section five presents the results. Section six discusses the implications, section seven concludes the study, followed by references.
2. Literature Review
2.1 Early Academic Skepticism
Historically, there has been skepticism towards technical analysis in academia. Technical analysis was originally conceptualized around observed patterns rather than formal theory. Some studies, such as Tabell and Tabell’s (1964), emphasize Dow Theory and the Elliott Wave Principle, highlighting cycles and human behavior, themes still relevant today. Levy (1966) offers a more neutral perspective, critiquing both technical and fundamental approaches to trading. While he finds more empirical support for fundamental analysis, his openness suggests that even early researchers saw potential for technical signals to reflect meaningful information. Other studies go further by testing technical analysis and find no edge, concluding that price behaves randomly. Van Horne and Parker (1968) test a moving average and do not find excess returns, and are often cited as one of the earliest academic rejections of technical analysis. Their paper, however, is methodologically limited by a small sample size and lacks out-of-sample testing, limitations that this paper will address with modern tools and risk framing.
2.2 Conditional Effectiveness and Market Context
More modern studies suggest that technical analysis may work in certain market conditions. Han, Yang, and Zhou (2013) and Brown, Crocker, and Foerster (2009) both find that using moving average and buy-and-hold strategies, assets with higher risk components like volatility and turnover earn higher returns. This supports the idea that investor behavior and market dynamics may create price movements that technical analysis is better suited to capture than fundamental analysis. This may imply success in specific market conditions, particularly conditions that are traditionally avoided.
Building on this conditionality, other studies explore when and why technical analysis might work. Bessembinder and Chan (1998) similarly show that technical trading rules may have statistical predictive power, but lack economic significance due to trading costs and nonsynchronous trading effects. This counters the notion of technical analysis as a magic bullet for market context. Likewise, Qi and Wu (2006) test thousands of trading rules and find conditional effectiveness in the earlier half of their sample period, indicating that technical analysis may exploit inefficient markets. Together, these studies suggest that technical analysis can be used as a lens for inefficiency, a concept that will be explored further in this paper.
2.3 Behavioral and Structural Explanations
Many papers support the idea of technical analysis as a filter for behavior and structure. Smith et al. (2016) and Moosa and Li (2011) argue that technical levels correspond with real behavioral structures in different markets. The former shows that hedge funds using technical analysis have higher returns during periods of high sentiment, highlighting the connection to irrational investor behavior. The latter investigates the disproportionate success of technical strategies in Chinese markets, examining the distortion of markets by government intervention and high retail participation. These behavioral patterns may create a unique environment suitable for technical analysis where rational models fail. Other studies, such as Blume et al. (1994) and Kavajecz and Odders-White (2004), find correlations between specific signals and market information. Blume et al. argue that volume reflects trader confidence, while Kavajecz and Odders-White find an alignment between technical indicators and changes in liquidity. These findings imply that, in addition to behavior, structural market components may help inform the conditions where technical analysis could be successful.
2.4 Agreements and Differences
Across the literature, two general camps emerge. Early research, represented by Van Horne and Parker (1968), contends that technical analysis lacks predictive ability, even after accounting for randomness and naïve benchmarks. More recent research, however, finds pockets of conditional efficacy, whether due to market regimes (Han, Yang, & Zhou, 2013; Qi & Wu, 2006) or behavioral/structural patterns (Smith et al., 2016; Moosa & Li, 2011). Where the camps converge is in emphasizing the role of context: even the most ardent supporters recognize that strategy efficacy relies on particular circumstances, whereas skeptics admit anomalies may appear in particular settings. The disagreement is in whether those circumstances are exploitable after costs, and whether findings represent persistent inefficiencies or fleeting artifacts of market design.
This divide directly shapes our methodological choices. First, to address concerns over sample bias and parameter overfitting, we evaluate a multi-signal strategy rather than isolated rules, mirroring how traders filter entries. Second, we incorporate transaction cost adjustments to test whether any gross profitability survives realistic frictions, a point stressed by cost-sensitive studies like Bessembinder and Chan (1998). Finally, inspired by the state-dependent findings in both behavioral and structural work, we adopt a rolling quarterly parameter optimization to account for changing market conditions. This design allows us to test not only whether the strategy performs overall, but also whether it behaves differently across varying environments, bridging the empirical gap between one-size-fits-all tests and purely context-specific studies.
3. Theoretical Context
3.1 Strategy Risk Profile and Testable Claim
We test whether a dual-signal RSI+MA strategy inherently loads on tail risk, marked by high kurtosis and near-zero or negative skewness, because it systematically buys into short-term weakness and sells into short-term strength relative to prevailing trends. In its mean-reversion phases, the strategy takes long positions when RSI signals oversold conditions in uptrends and short positions when RSI signals overbought conditions in downtrends. This pattern can produce many small gains interrupted by rare but significant losses (a “knife-catching” profile), yielding elevated kurtosis and potentially negative skewness. The SMA trend filter mitigates some of this tail risk but does not fully eliminate it. If these return characteristics align with risks that most investors avoid, the strategy may command a risk premium in expected returns.
3.2 Why Higher-Order Risks Matter
In finance, investors are not only concerned with the magnitude of returns, but also with the distribution of gains and losses. Traditional models like the Capital Asset Pricing Model (CAPM) focus on volatility and market sensitivity as the primary sources of risk. However, this framework often overlooks more complex behaviors in return distributions that describe the shape and extremity of gains and losses. For example, two assets might have the same average return and volatility, but one may suddenly crash while the other steadily gains, with investors generally preferring the latter. By intentionally taking on the types of risk that most investors avoid, a strategy may earn higher expected returns as compensation for bearing that discomfort. This paper explores the idea that technical analysis, though often dismissed as unscientific, can function as a filter for the risk exposures that investors implicitly price. This could allow strategies to profit by taking on return profiles that are mispriced or systematically avoided. Central to identifying these patterns are two higher-order risk moments, skewness and kurtosis.
3.3 Definitions and Investor Preferences
A growing body of research suggests that co-skewness and co-kurtosis are crucial in asset pricing. Skewness captures asymmetry in the return distributions of a portfolio. Positive skewness represents large gains with frequent small losses, while negative skewness represents frequent small gains with the potential for large losses. Kurtosis measures the tailedness of the 0 return distribution, where high kurtosis represents a higher probability of extreme values, while low kurtosis represents a lower probability of extreme values.
Co-skewness and co-kurtosis, then, are the relationships between these metrics when comparing one variable to another, generally an asset compared to the market portfolio. Co-skewness describes how the asymmetry of one variable’s distribution is connected to movements in another variable. Co-kurtosis describes how the tendency for extreme values in one variable is connected to movements in another variable. A portfolio with negative co-skewness and high co-kurtosis, for example, tends to suffer its worst losses at the same time as the market, and experiences extreme returns in the same period, amplifying drawdown. However, CAPM suggests that assets performing poorly when investors most value consumption must offer higher expected returns as compensation. Because bad co-skewness and co-kurtosis are so unattractive to investors, the risk may be compensated for.
3.4 Pricing of Higher-Order Risks
Some studies explain this correlation between investor behavior and higher-order risk moments. Conrad, Dittmar, and Ghysels (2013) argue that skewness isn’t only measurable in hindsight, and that investors price ex ante skewness through the options market. They find that stocks with more expected negative skewness earn higher average returns, consistent with the theory that investments with more inherent risk require more compensation. The authors also find that stocks with positive expected skewness earn lower average returns, but the potential for large positive price changes remains attractive to investors. Frugier (2014) adds to this conclusion, arguing that these higher-order moments are embedded signals of trader psychology. He examines past stock data and finds that negative skewness and high kurtosis arise in times of 1 unresolved uncertainty and fear, indicating these psychological factors. These studies show that skewness and kurtosis must be priced in because investors prefer certain shapes of risk, like the frequency and size of gains and losses. These findings suggest that technical analysis could succeed if it accurately filters undesirable risk exposures that demand higher returns.
3.5 Institutional and Practical Evidence
Similar filters seem to be used in institutional trading. A study by Malkiel and Saha (2005) investigates risk exposure in hedge funds. They find that an overwhelming majority of hedge funds in the TASS database exhibit returns with low skewness and high kurtosis, generally avoided by traditional investors. This is supported by Elkamhi and Stefanova (2015), who show that in volatility-based portfolios, even small exposures to skewness and kurtosis can lead to outsized losses. Because of this, portfolios would benefit from explicit identification of these moments to hedge against them. If technical analysis can isolate exposure to higher-order risks, it should be viewed as a way to expand the investor’s span, to broaden the set of priced risks a portfolio can intentionally target or avoid. Technical strategies can be evaluated not just on signal accuracy, but on whether their return profiles reflect exposure to hidden risks. This perspective will be tested in the analysis that follows.
4. Strategy and Methodology
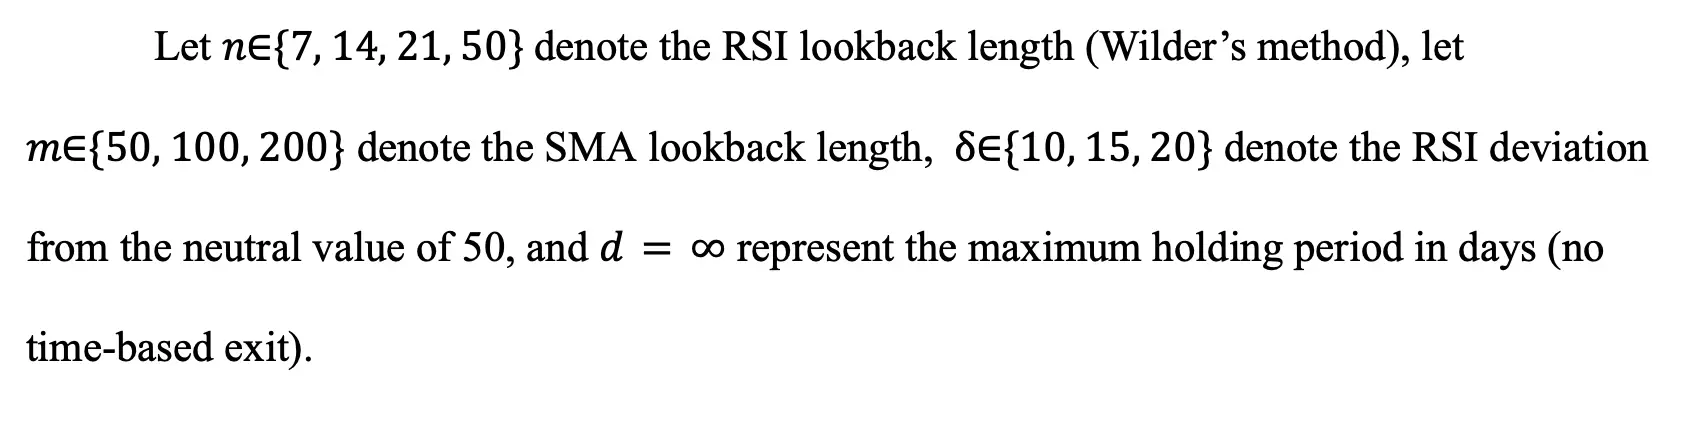
This strategy will test multiple combinations of the Relative Strength Index (RSI) and moving average (MA). The RSI(14) and MA(200) are the most standard values, and these period lengths are commonly referenced in social media posts. Other lengths modify the quantity, and 2 potentially ‘quality’ of each signal as trends become smoother with greater lengths. However, market conditions may affect this ‘quality’, so we perform a quarterly walk-forward selection of RSI and MA combinations to optimize for shifting regimes.
4.1 Universe & Data
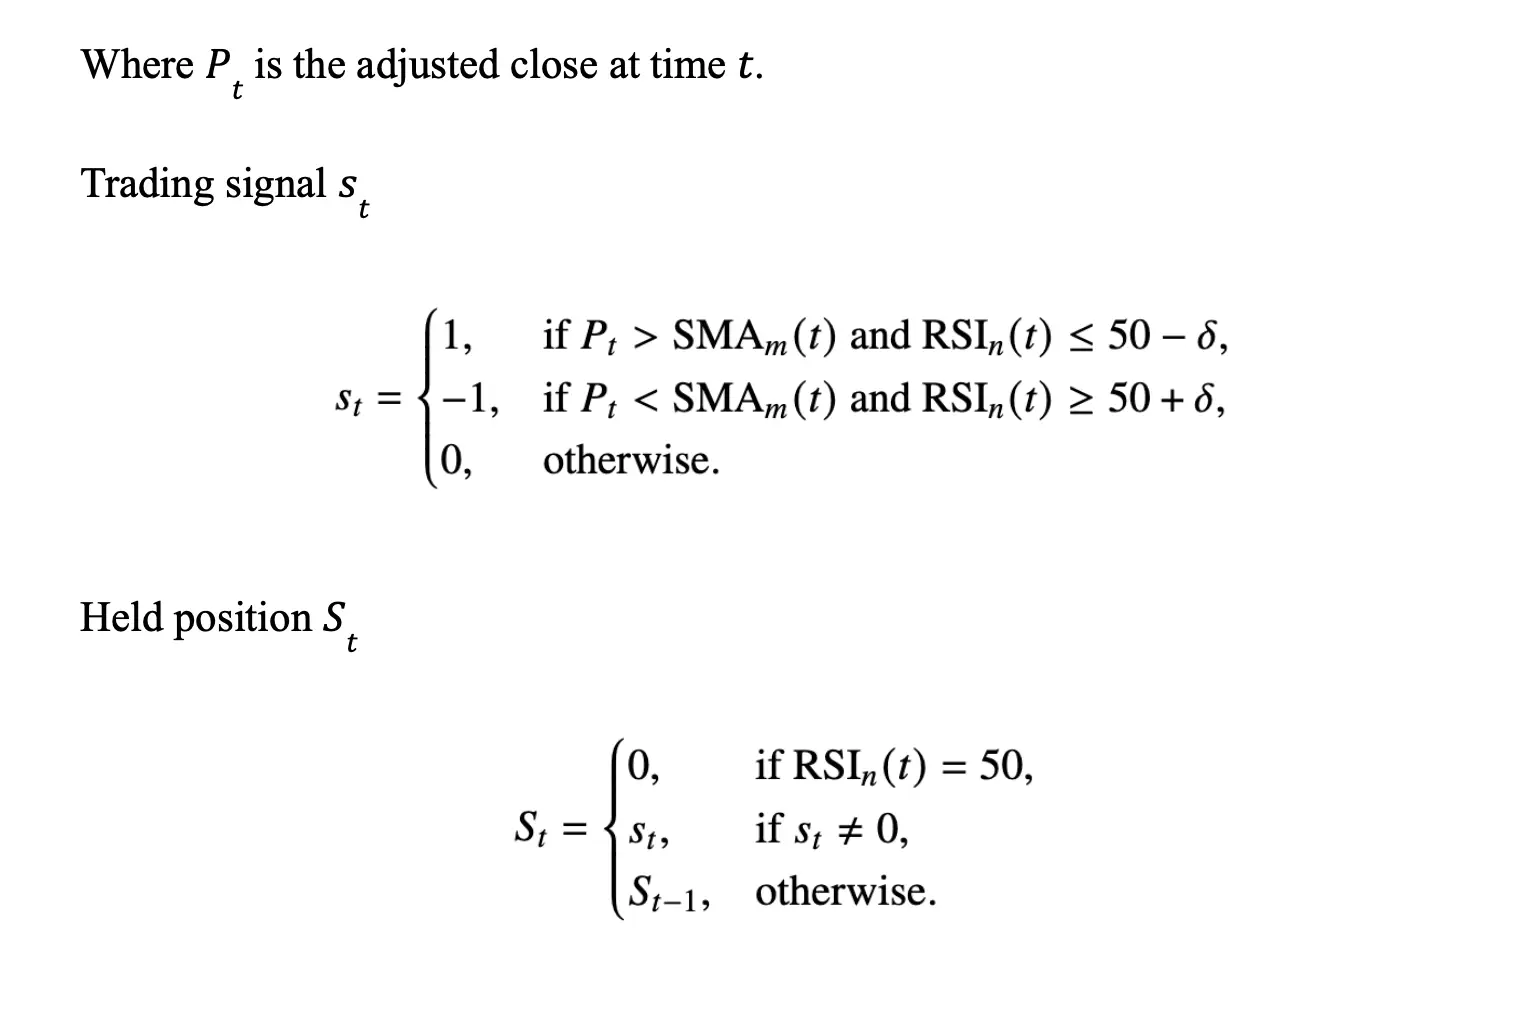
We retrieved daily price data for all 30 constituents of the Dow Jones Industrial Average (DJIA) over ten years (July 18, 2015, to July 18, 2025) from the Yahoo Finance Historical Data API (see Appendix for the full list of tickers). Results are non-point-in-time, backfilled from the most recent members. We used close prices adjusted for dividends and splits.
4.2 Signal Construction
The RSI is computed on adjusted closes using Wilder’s smoothing as:
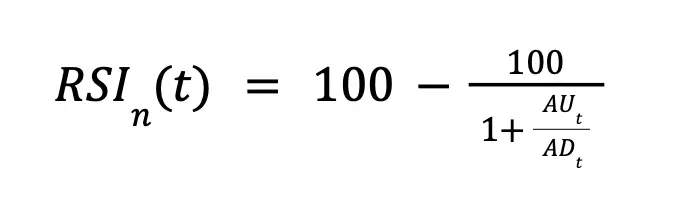
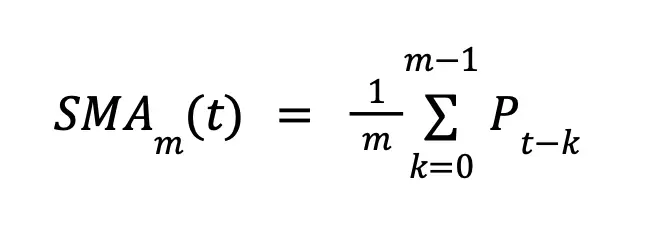
Where AUt and ADt are the exponentially smoothed average gains and losses over n days. The SMA is calculated as:
4.3 Position Sizing and Execution Convention
Signals are generated and executed at the close on day t. Each stock may trigger at most one entry per day, and each position is allocated 1/10 of the total portfolio value to avoid concentration risk. Position weight per stock is fixed-weight per trade. Buy and sell signals are processed independently for each stock.
4.4 Walk-Forward Selection
To adapt the strategy to evolving market conditions, we partitioned the 10-year sample into 40 quarterly segments. For each RSI deviation threshold (10, 15, and 20), an initial quarter runs with default parameters of RSI(50) and SMA(200). At the end of each quarter, we evaluate RSI and SMA combinations based on their Sharpe ratios. We apply the combination with the highest Sharpe ratio to the next quarter. This process repeats in a walk-forward fashion across all 40 quarters, producing a series of returns in which each quarter’s parameters reflect the most profitable configuration from the preceding quarter.
4.5 Shorting
This backtest assumes that short sales are permitted for all DJIA constituents at all times, with full borrow availability. A borrowing cost is applied to all open short positions, representing the annualized interest rate charged for borrowing shares. This cost, denoted cb , is assumed to fall within the range of 30-50 basis points per year (0.30%-0.50%), with the base case using = cb 0.50%.
This daily borrow charge is calculated as:

Where ShortNotionalt is the dollar value of the short position on day t . Borrow costs t are deducted from portfolio equity each day the short position remains open. Dividend payments owed on short positions are already incorporated in the adjusted price series used for return calculations, so no separate adjustment is required.
4.6 Transaction Costs
Transaction costs were incorporated by first calculating daily portfolio turnover as the average absolute position change across the 30 DJIA stocks.
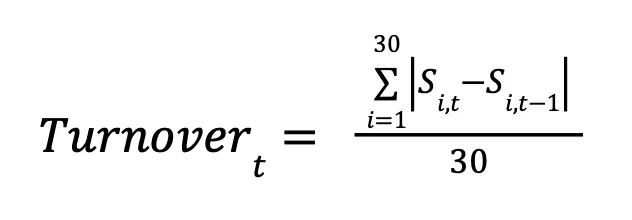
We multiplied this turnover by a per-dollar transaction cost rate c to estimate daily cost drag.

We then calculated the Compound Annual Growth Rate (CAGR) from the net return series, with results reported for costs of 0, 2, 5, and 10 basis points per side.
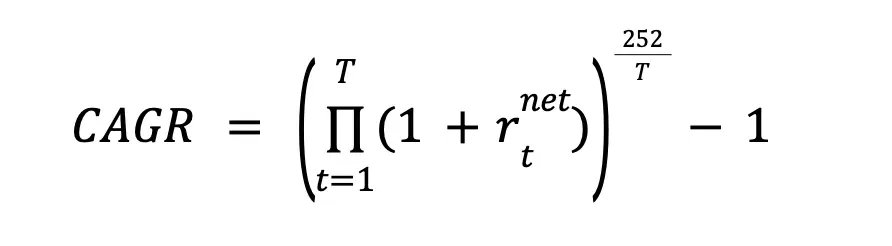
All other performance metrics are based on gross returns, with the impact of transaction costs summarized separately in the CAGR table.
4.7 Risk and Return Metrics
We evaluate portfolio performance using a set of risk-adjusted and distributional metrics. The Sharpe ratio is computed using Newey-West adjusted standard errors to account for serial correlation in daily returns.
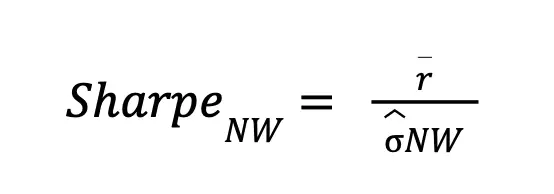
r o represents the daily average return of our portfolio, while NW represents the standard deviation of returns that has been adjusted for autocorrelation (the similarity between a variable’s values at different points in time) and heteroskedasticity (the spread of standard deviations of a variable).
We use a Calmar ratio to measure the trade-off between annualized return and maximum drawdown.
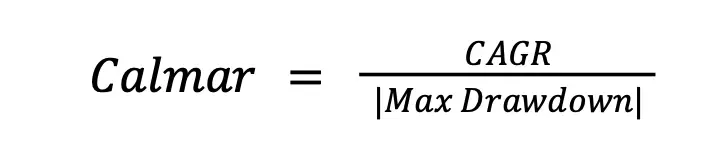
Where CAGR is the Compound Annual Growth Rate of our portfolio over the testing period, and the denominator is the absolute value of the maximum drawdown of the portfolio.
The Sortino ratio isolates downside volatility as opposed to both sides.
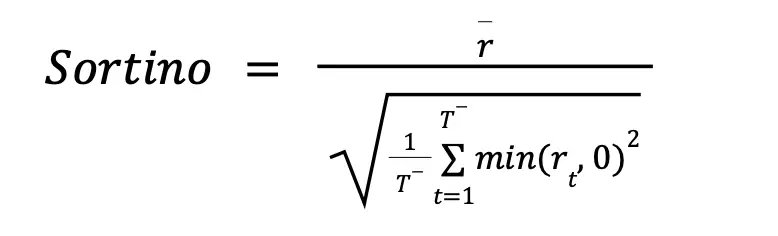
Where T— is the number of days with negative returns, and rt the return on day t. Wholly, the denominator represents downside deviation, or the standard deviation of negative returns.
Skewness and kurtosis are computed to assess asymmetry and tail heaviness in the return distribution.
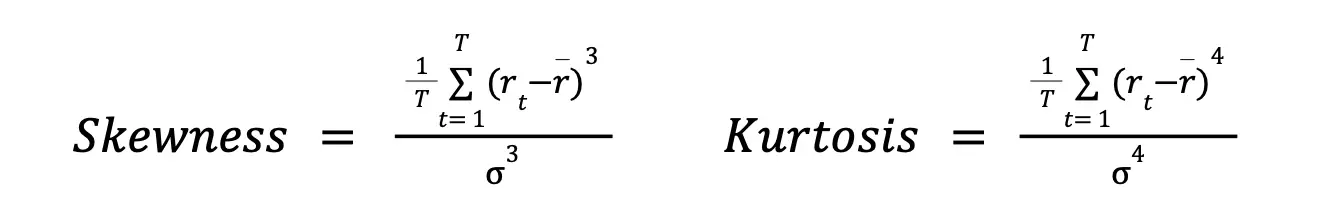
Where T o represents the total number of days in the sample and represents the standard deviation of all returns. Skewness represents asymmetry of the return distribution (whether it is more tilted to gains or losses). Kurtosis represents the “tailedness” of the distribution (the likelihood of extreme gains or losses). All ratios are computed using gross daily returns unless otherwise noted, with transaction-cost-adjusted returns reported separately.
5. Results
This section presents the performance of an RSI and MA strategy under three different threshold configurations: DEV 10, DEV 15, and DEV 20. These values represent the entry condition deviation in RSI. Results are based on a portfolio spanning July 2015 to July 2025.
5.1 Cumulative Returns
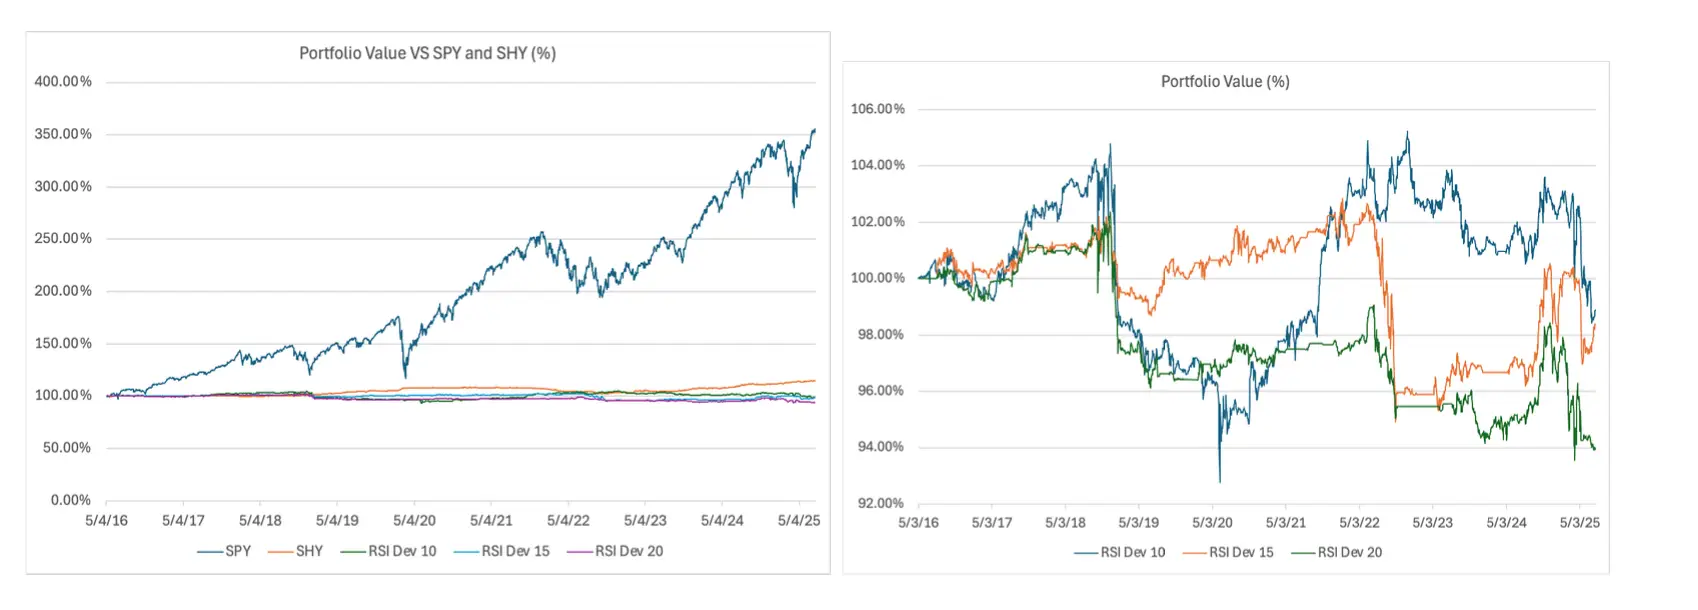
The cumulative return chart shows diverging performance across the three RSI deviation tests, all ending with negative returns. Differences in performance begin to emerge in mid-2017, early in the testing period. DEV 10 (blue) showed brief periods of positive returns and was the most volatile, ending with the highest return of the three. DEV 15 and 20, although considerably more stable in return trajectory, finished with even lower returns. Returns tended to move in the same direction for most of the period, suggesting positive covariance between strategies.
5.2 Annualized Metrics
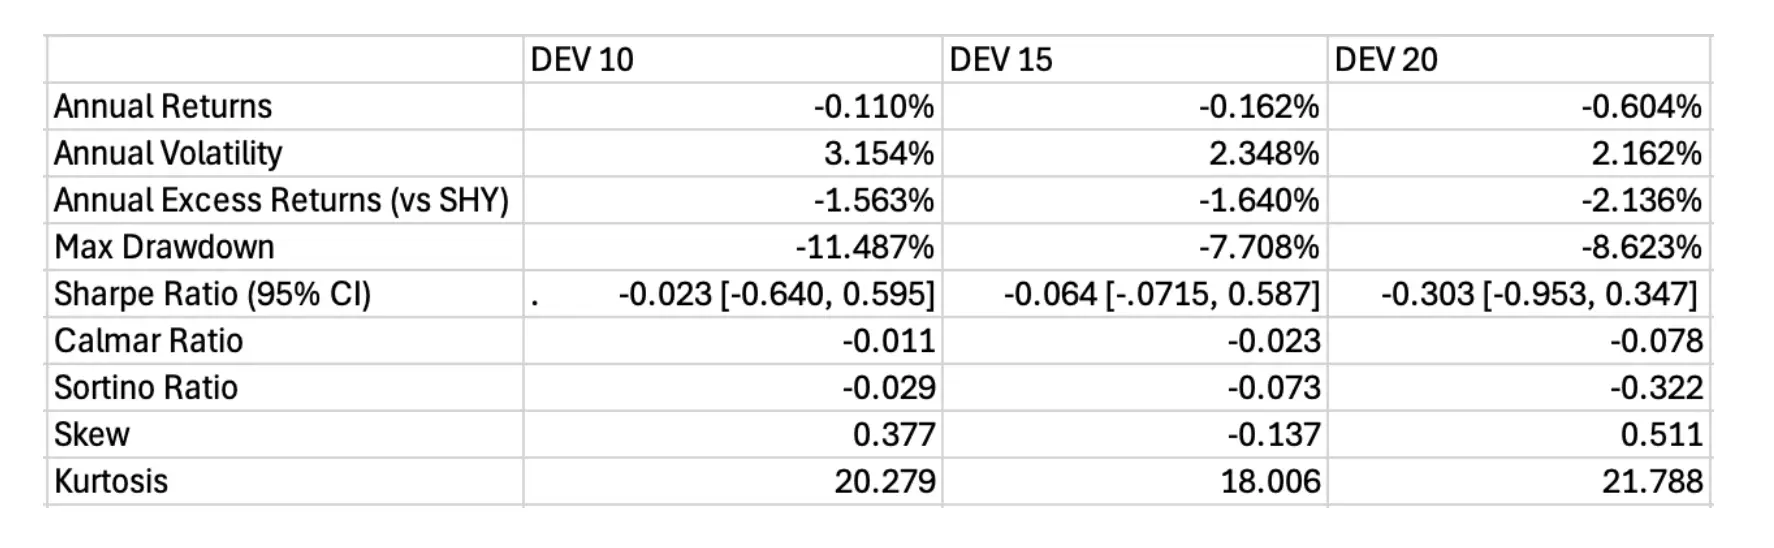
Annual returns were negative across all three configurations. Annual excess returns versus SHY and SPY were also negative, the lowest being DEV 20 (-2.129%) and the highest being DEV 10 (-1.514%). V olatility followed the same pattern, from 2.162% (DEV 20) to 3.154% (DEV 10). The Sharpe ratio also decreased with higher deviation thresholds, ranging from -0.480 (DEV 10) to -0.985 (DEV 20). However, 95% Newey-West adjusted confidence intervals for the Sharpe ratios include 0 in all three strategies, implying that the Sharpe ratios are statistically insignificant. Small, negative Sortino and Calmar ratios suggest poor performance compared to risk-free assets and drawdown, indicating greater downside risk.
5.3 Transaction Costs
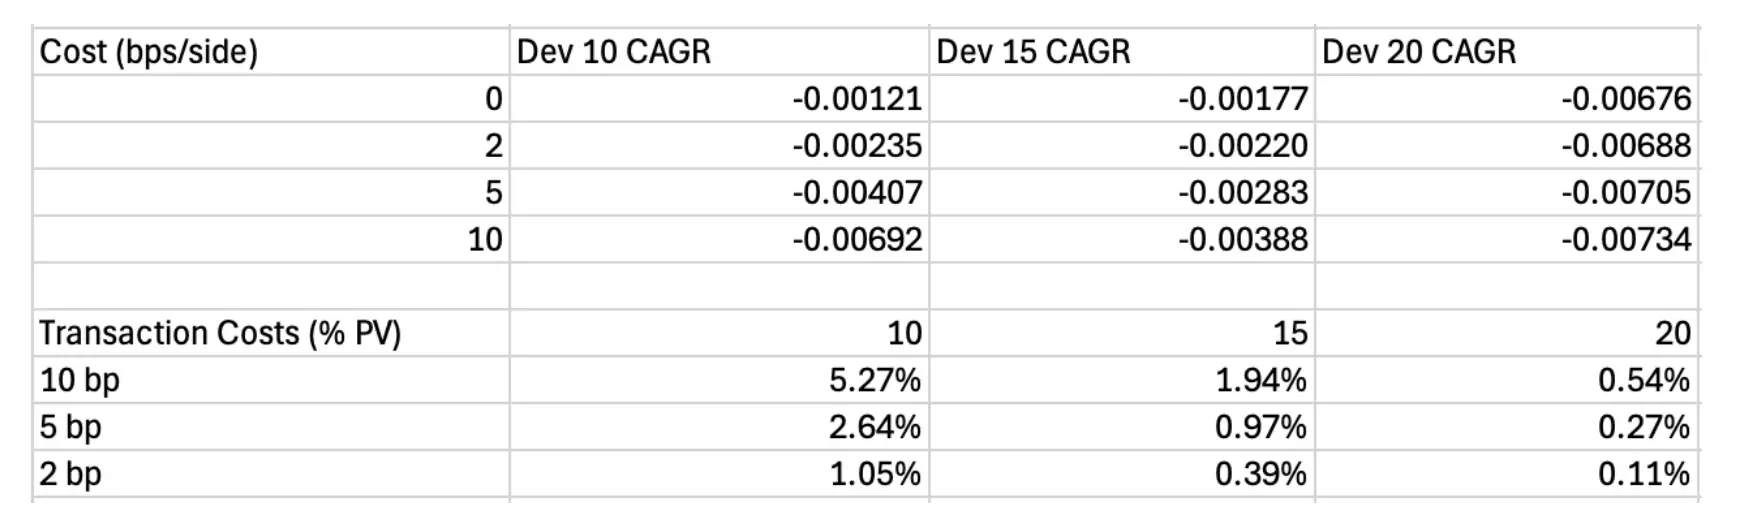
To address the effects of transaction costs, we recalculated CAGR for each RSI Dev strategy after applying per-dollar transaction costs of 0, 2, 5, and 10 basis points per side. Across all three strategies, higher transaction costs reduced CAGR approximately linearly with cost magnitude. For further context, we calculated total transaction costs as a percentage of portfolio value. Dev 10 exhibited the highest turnover (5.25% at 10 bps), confirming that smaller deviation thresholds are more sensitive to cost assumptions.
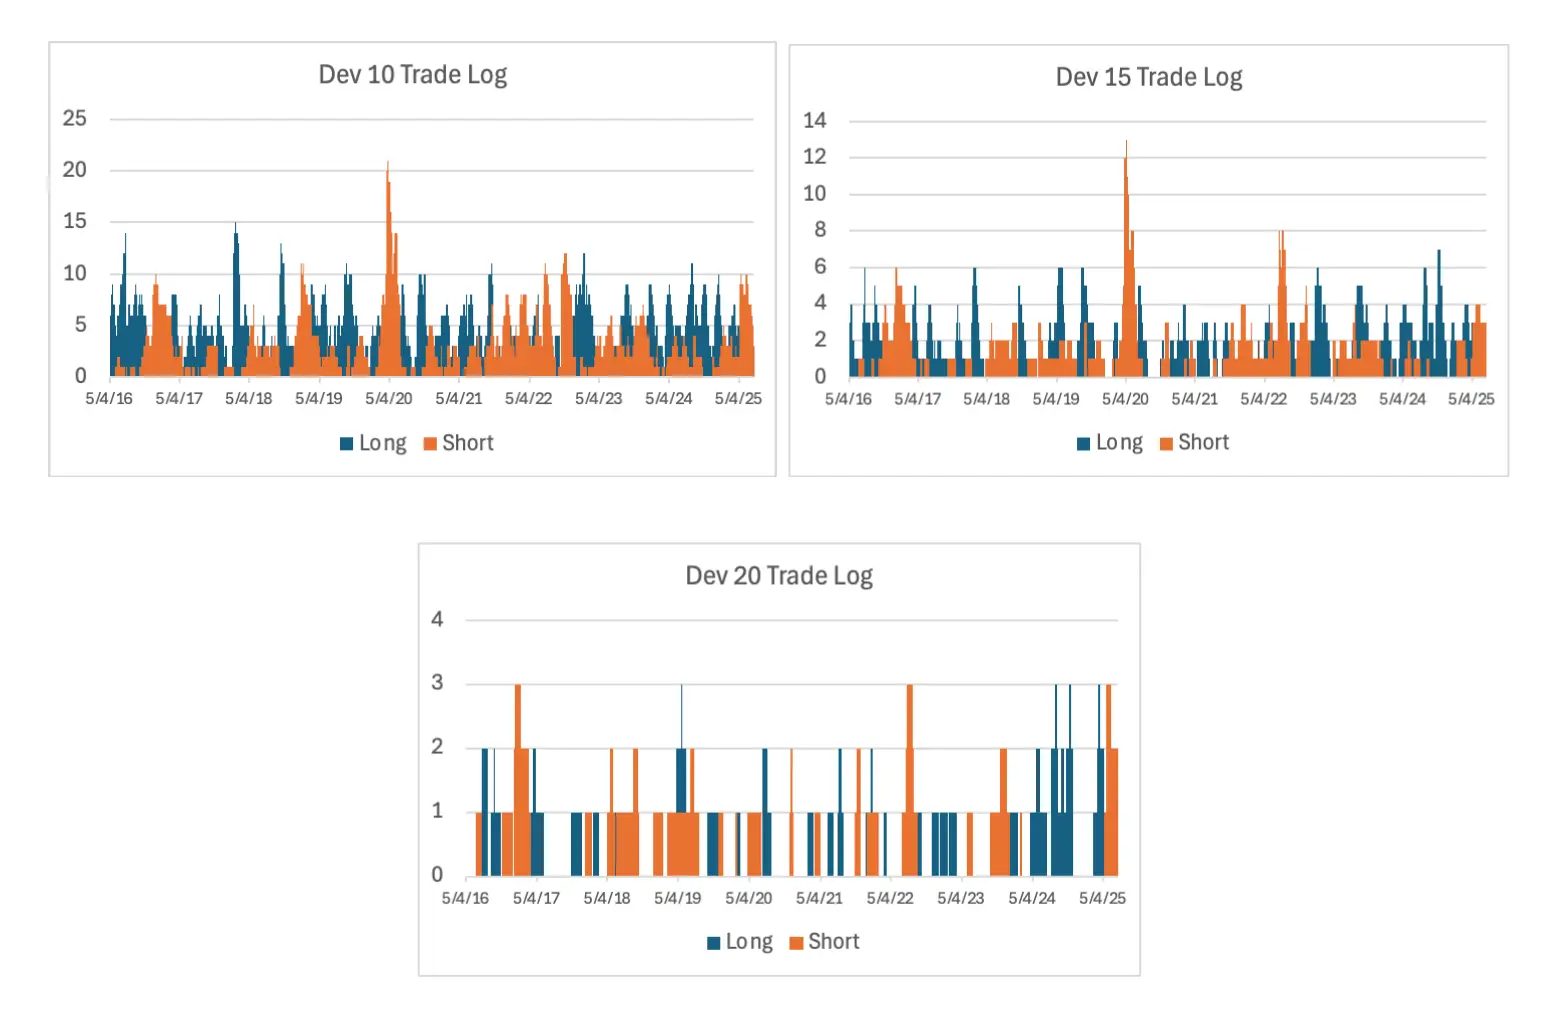
The above graphs show trade logs for each strategy, blue representing long trades and orange representing short trades. This log contextualizes higher transaction costs for the lower threshold strategy, Dev 10, which had the highest trade volume.
5.4 Return Distributions
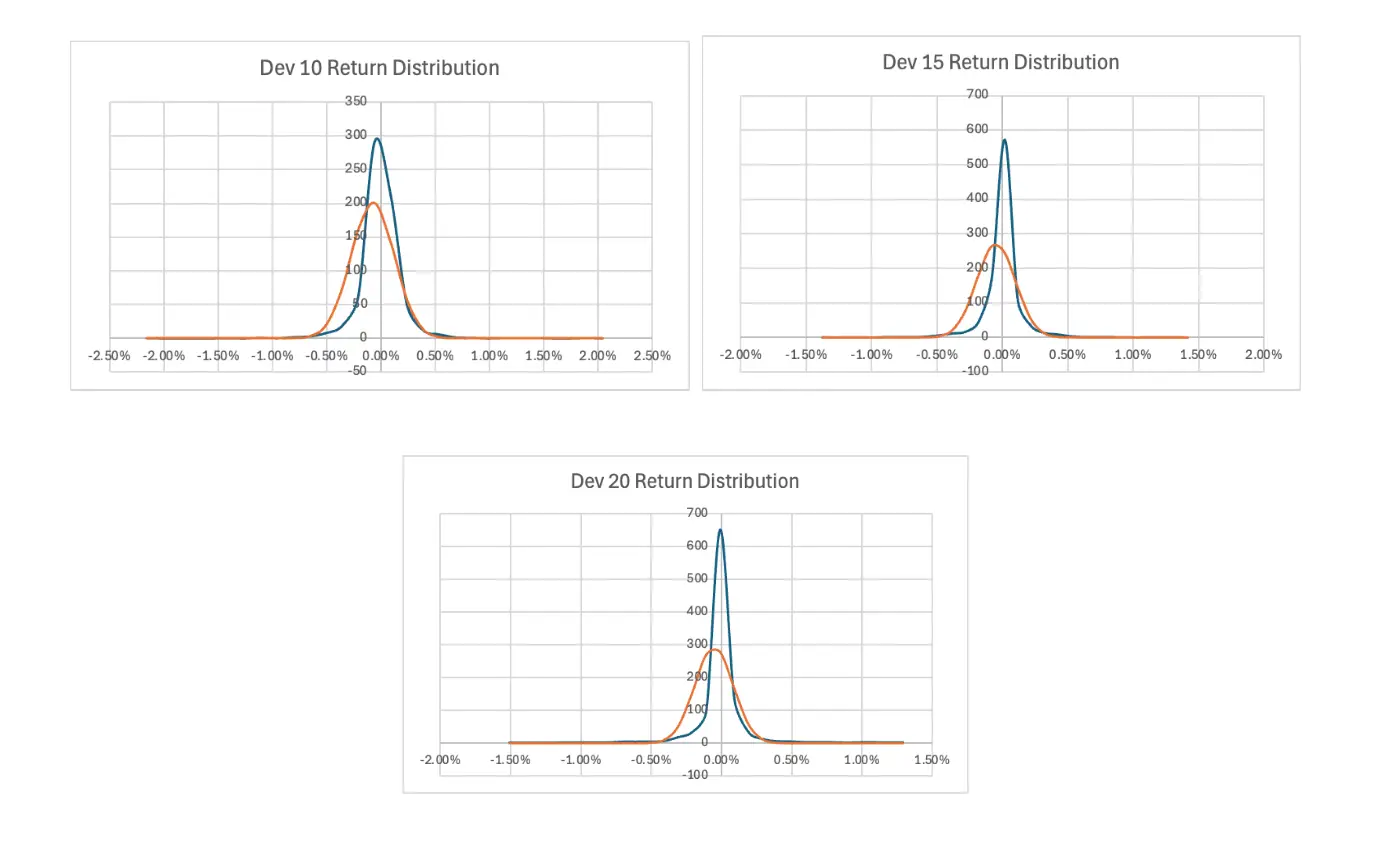
Returns for all three strategies were density-adjusted and compared to normal distributions. Return distribution plots for each test show a sharper central peak and heavier tails than Gaussian (high excess kurtosis). All three strategies display high kurtosis with values ranging from 18.006 (DEV 15) to 21.788 (DEV 20). Although most returns are clustered around the mean, this shows that these strategies experienced a significantly higher frequency of extreme return days than a normal distribution.
Skewness values ranged from low (DEV 10 and DEV 15) to low-moderate (DEV 20). DEV 10 and DEV 20 had positive skew, implying a higher probability of large positive gains, while DEV 15 had a negative skew and a tendency towards large negative gains.
6. Discussion
This section interprets the performance of the RSI and MA strategy beyond raw returns. While the strategy underperformed, its results reveal insights into market efficiency, hidden risk exposures, and the conditional role of technical analysis.
6.1 Underperformance and Market Efficiency
The RSI and MA strategy tested in this paper underperformed across all annualized metrics in the ten-year testing period, but its implications suggest a broader role of technical analysis in risk exposure. All three strategy variants show negative risk-adjusted values when compared to SHY and display negative Sharpe, Calmar, and Sortino ratios. These outcomes are consistent with the weak form of the Efficient Market Hypothesis, which holds that past price data contains no predictive or actionable information. However, this underperformance does not imply that the signals were entirely random or meaningless. The return paths of DEV 10, 15, and 20 were similar for most of the ten years. Positive covariance in the three strategy variations suggests exposure to similar structural patterns in the market. The strategy may not unconditionally generate alpha, but it might expose investors to certain risks hidden in asset prices.
6.2 Hidden Risk Exposure and Conditional Opportunity
The most compelling pattern in the results is the consistently high kurtosis. This indicates frequent extreme returns, which traditional investors tend to avoid due to financial and psychological discomfort. Relatively low skewness values indicate minor asymmetry in returns, but the heavy-tailed return distributions suggest that the RSI and MA strategy filters for hidden, 2 non-diversifiable risk. This aligns with research by Conrad et al. (2013) and Frugier (2014), who argue that investors price these risks because they reflect the large, abrupt losses during ‘bad times’.
Consistency across all three thresholds suggests that the strategy systematically targets certain classes of risk that are not rewarded over long periods, but may be under unique conditions. This helps explain the underperformance, as strategies with undesirable risk (high kurtosis and low skewness) should not be expected to outperform in all periods, especially in a mostly efficient market. However, it might work over certain regimes where these risks are mispriced, such as volatility clusters and trend reversals.
6.3 Reframing Technical Analysis
Instead of interpreting the negative returns as evidence against technical analysis, these results suggest a more nuanced framing. The value of the RSI and MA strategy is likely not in forecasting price but in allowing investors to bear discomfort in exchange for higher compensation. This is only possible, of course, with research into exactly when and where these strategies conditionally succeed. This can be tested across periods segmented by different macroeconomic factors, and doing so might reveal how technical analysis’s payoffs align with inefficiency-prone conditions.
Ultimately, although this study does not contradict market efficiency, it reveals how technical analysis could account for shortcomings of traditional investment strategies. It might add value by identifying risks that investors expect compensation for. In this way, it can be used as a tool for portfolio construction to access unconventional sources of returns, or simply to hedge against risks in traditional portfolios.
7. Conclusion
In conclusion, this study tested a widely used technical trading strategy, a combination of the Relative Strength Index and moving average. The analysis spanned ten years and evaluated three different RSI deviation thresholds. While the strategy underperformed across all key return metrics, its characteristics offer important insights into the academic and practical discourse around technical analysis. The strategy’s exposure to extreme returns, seen in its high kurtosis, suggests that it filters for hidden, non-diversifiable risk. This finding is relevant in today’s markets, where signal-based strategies are frequently promoted across social media platforms and adopted by traders in search of an edge. Understanding what these strategies are actually capturing, even when they fail to generate alpha, is essential to evaluating their role in constructing portfolios and risk management.
For researchers, these findings support a reframing of technical analysis as a mechanism for identifying priced risk exposures. Further study should test performance in different market conditions where these risks might be mispriced. For traders and portfolio managers, these findings emphasize the risk structure behind technical analysis. While signals like the RSI and MA might not yield consistent profits, they can help in designing portfolios that take advantage of risks that are compensated under certain conditions. This understanding can also help retail traders avoid misusing signals as forecasters of price action. In this way, the lasting contribution of technical analysis is not its forecasts, but its ability to expose the risks that markets reward.
References
Bessembinder, H., & Chan, K. (1998). Market Efficiency and the Returns to Technical Analysis. Financial Management, 27(2), 5–17. https://doi.org/10.2307/3666289
Blume, L., Easley, D., & O’Hara, M. (1994). Market Statistics and Technical Analysis: The Role of V olume. The Journal of Finance, 49(1), 153–181. https://doi.org/10.2307/2329139
Brock, W., Lakonishok, J., & LeBaron, B. (1992). Simple Technical Trading Rules and the Stochastic Properties of Stock Returns. The Journal of Finance, 47(5), 1731–1764. https://doi.org/10.2307/2328994
Brown, J. H., Crocker, D. K., & Foerster, S. R. (2009). Trading V olume and Stock Investments. Financial Analysts Journal, 65(2), 67–84. http://www.jstor.org/stable/40390354
Conrad, J., Dittmar, R. F., & Ghysels, E. (2013). Ex Ante Skewness and Expected Stock Returns. The Journal of Finance, 68(1), 85–124. http://www.jstor.org/stable/23324392
Elkamhi, R., & Stefanova, D. (2015). Dynamic Hedging and Extreme Asset Co-movements. The Review of Financial Studies, 28(3), 743–790. http://www.jstor.org/stable/24465726
Frugier, A. (2014). Higher-order Moments and Investor Sentiment (Alles’ Model Revisited). Quarterly Journal of Finance and Accounting, 51(3–4), 45–70. http://www.jstor.org/stable/qjfinacct.51.3-4.45
Han, Y ., Yang, K., & Zhou, G. (2013). A New Anomaly: The Cross-Sectional Profitability of Technical Analysis. The Journal of Financial and Quantitative Analysis, 48(5), 1433–1461. http://www.jstor.org/stable/43303847
Kavajecz, K. A., & Odders-White, E. R. (2004). Technical Analysis and Liquidity Provision. The Review of Financial Studies, 17(4), 1043–1071. http://www.jstor.org/stable/3598058 5
Levy, R. A. (1966). Conceptual Foundations of Technical Analysis. Financial Analysts Journal, 22(4), 83–89. http://www.jstor.org/stable/4470026
Malkiel, B. G., & Saha, A. (2005). Hedge Funds: Risk and Return. Financial Analysts Journal, 61(6), 80–88. http://www.jstor.org/stable/4480718
McInish, T., & Puglisi, D. J. (1980). Technical Analysis and Utility Preferred Stocks. Nebraska Journal of Economics and Business, 19(3), 55–63. http://www.jstor.org/stable/40472670
Moosa, I., & Li, L. (2011). Technical and Fundamental Trading in the Chinese Stock Market: Evidence Based on Time-Series and Panel Data. Emerging Markets Finance & Trade, 47, 23–31. http://www.jstor.org/stable/27917672
Neely, C. J., Rapach, D. E., Tu, J., & Zhou, G. (2014). Forecasting the Equity Risk Premium: The Role of Technical Indicators. Management Science, 60(7), 1772–1791. http://www.jstor.org/stable/42919633
Qi, M., & Wu, Y . (2006). Technical Trading-Rule Profitability, Data Snooping, and Reality Check: Evidence from the Foreign Exchange Market. Journal of Money, Credit and Banking, 38(8), 2135–2158. http://www.jstor.org/stable/4123046
Smith, D. M., Wang, N., Wang, Y ., & Zychowicz, E. J. (2016). Sentiment and the Effectiveness of Technical Analysis: Evidence from the Hedge Fund Industry. The Journal of Financial and Quantitative Analysis, 51(6), 1991–2013. http://www.jstor.org/stable/44157641
Tabell, Edmund W., & Tabell, Anthony W. (1964). The Case for Technical Analysis. Financial Analysts Journal, 20(2), 67–76. http://www.jstor.org/stable/4469619
Van Horne, J. C., & George G. C. Parker. (1968). Technical Trading Rules: A Comment. Financial Analysts Journal, 24(4), 128–132. http://www.jstor.org/stable/4470382
Yahoo Finance. (2025). Dow Jones Industrial Average historical data [Data set]. Yahoo. Retrieved July 18, 2025, from https://finance.yahoo.com/
About the author
Roshan Shah
Roshan is currently a senior at Glenbrook South High School in Glenview, Illinois. He intends to complete an undergraduate degree in Applied Mathematics. He is particularly interested in the intersection of mathematics, computer science, and finance, and looks forward to pursuing a career in financial technology. In his free time, Roshan enjoys a wide variety of extracurricular activities, including Model United Nations, digital music production, working out at the gym, and spending time with friends. He also enjoys helping his community by providing food and clothing to the homeless in Chicago.