

Author: Ishaan Bafna
Mentor: Dr. Zack Michaelson
Kingswood Oxford School
Abstract
This paper explores the complex relationship between tariffs on Gross Domestic Product (GDP) and the U.S. trade balances with its major trading partners. It investigates if imports and greater trade balances changed between the U.S and its top trading partners after tariffs were placed. The conclusion is no significant change in trade balances since the implementation of the Trump administration’s tariffs.
The evidence shows that in the months of April to July, the tariffs have not significantly changed U.S. net trade. The effects studied in this paper are a result of new trade policies by the Trump Administration which put retaliatory tariffs on most of the world. As a result, many firms and businesses frontloaded the tariffs which caused a 40% increase in imports in Q1 2025. Also in Q1, real GDP decreased by 0.5% (U.S. Bureau of Economic Analysis, 2025) according to the most recent estimate. However, imports do not reduce GDP and are only included in the calculation to support accounting principles. As a result of this misconception, many news articles written by journalists who are not economists have had misleading claims with regards to the GDP decrease. The current results of the findings could potentially be attributed to the uncertainty in the administration’s tariff policy or simply that not enough time has passed for significant changes to be observable in the data.
Introduction & Literature Review
The role of imports in shaping a nation’s economy has become increasingly significant following President Trump’s trade wars and tariffs on countries across the world. Many of these tariffs were put during the first quarter of 2025 while the others were placed on April 2, 2025, also known as Liberation Day. However, news of President Trump’s intention of using tariffs has been clear before his Inauguration and use of tariffs on foreign countries was common in his first term as well. Since his election, many businesses and firms have increased inventories and the amount of imported goods in anticipation of high tariff rates to go into effect soon.
As noted above, the heart of GDP measurement is the widely cited expenditure formula: GDP = C + I + G + (X-M) where C denotes consumption, I investment, G government expenditures, X exports, and M imports. The superficial glance at this equation shows imports as a direct drag on GDP. However, economists consistently clarify that this superficial glance is quite misleading as the negative sign simply represents an accounting principle to prevent double counting.
Bill Conerly (2025), a writer at Forbes, clarifies that “U.S. imports are neither added nor subtracted conceptually” (para. 3) for GDP. He explains that with perfect data available to statisticians, imports wouldn’t be included in a GDP calculation (Conerly, 2025).
Looking at the subtraction, Greg Mankiw notes, “this subtraction is made because imports of goods and services are included in other components of GDP,” (Mankiw, 2001, p. 499) Mankiw also notes how a purchase of an imported good raises consumption, investment or government expenditures.
The St. Louis Fed adds that “imports (foreign production) should have no impact on GDP,”(Wolla, 2018, para. 9). They explain the variable M as an accounting variable rather than an expenditure variable. It is also important to note that the imported goods will have an effect on the GDP of the country that produces them. Since it isn’t the United States, they don’t affect U.S. GDP. However, it can take into account if the goods are intermediate or partially produced in the U.S. Since the expenditure variables of C, I, and G only take final goods into account, GDP will be affected based on the amount of the goods that was domestically produced.
Keshav Srikant, a writer with Econofact, supports the net-zero effect on imports on GDP. However, he also notes how imports can potentially indirectly reduce GDP if they replace domestic consumption or if domestic government expenditures are reduced as a result of higher purchases of foreign goods (Srikant 2025). Further study of macroeconomic trends are required to make an argument for this situation as these latent variables could drive import growth and GDP declines when those two variables are not correlated.
Ultimately, imports do not directly reduce GDP and their inclusion in the components of GDP is a measure to prevent double counting.
There are many researchers who have explored the growth of imports and its, relationship with the overall economy. In fact, many specific case studies have found that an increase in imports often leads to an increase in real GDP .
A study by Peter Saunders, focused on a time series analysis of the role of imports in the economic rise of India from 1970 to 2005, analyzes the long term relationship between imports and India’s real GDP. Saunders establishes that both variables, imports and real GDP, are cointegrated using Johansen’s test of cointegration (Saunders 2010). This test proves if two variables have a long term equilibrium relationship, meaning that despite short term deviations or outliers, the variables have a long term observed relationship. A Vector Error Correction Model (VECM) examines the relationship between cointegrated variables. In the VECM used by Saunders, the results indicated that imports have positively impacted India’s economic growth in the short-term. Saunders highlights how this result defies traditional expectations that imports could be a drag on the economy (Saunders 2010).
In another study by M.Y Khan et al, about the relationship between imports and economic growth in Pakistan, a similar conclusion was reached. This study used data from 1975 to 2014 with the methodology of a Granger Causality Test. This test focuses on proving directional relationships between time series variables. The results showed that there was a bi-directional relationship between imports and economic growth in Pakistan, meaning that both time series variables mutually supported one another (Khan et al, 2019).
Research focusing on the relationship Rwandan economic growth with imports and exports showed a positive long run relationship (Al Hemzawi & Umutoni 2021) . The study concluded that a one percent increase in imports led to a 0.32% rise in Rwandan GDP. To get that correlation, the authors used a multivariate Ordinary Least Squares regression which is a way to minimize variance between variables. They also used quarterly time series data in the regression.
Immediately after the Q1 GDP contraction was announced, many news publications released misleading or false articles regarding the cause behind this result. They accredited the cause to be the tariff jumping effect and the dramatic import surge that occurred because firms and businesses rushed to purchase foreign goods before tariff prices were assigned to goods. The underlying demand was quite consistent to previous levels while business investment surged as an offset to the imports. Despite the fact that imports do not directly reduce GDP, news outlets continued to push that narrative.
For example, an AP News article stated “First-quarter growth was weighed down by a surge of imports, ” (Wiseman 2025, para. 2) while The Hill said “GDP shrank in the first quarter mostly because of lower consumer spending and a pull-forward in imports ahead of President Trump’s tariffs, ” (Burns 2025,para. 4). Many other outlets made misleading claims regarding the import surge. Although journalistic misconceptions are not uncommon, even the Federal Open Market Committee has made mistakes with regards to the effect of imports on GDP (Lemieux 2018).
On the other hand, many top economists have had different opinions. Many economists have attributed the contraction to the economic activity as a result of the imports, not by the imports directly. For example, Paul Gruenwald, a global chief economist for S&P Global Ratings, mentioned that Q1 GDP data was “distorted by the front-running of tariffs,” (2025). Gregory Daco, a chief economist at EY , added “the contraction was largely a function of economic activity being pulled forward as importers, business, and consumers rushed to get ahead of tariff implementation,” (2025). Economist Preston Caldwell ofMorningstar added that imported goods could be stored in inventories but “it just didn’t show up in the data because of measurement error,” (2025).
Some top economists also challenged the fear that this GDP result was the first domino in a potential recession. Caldwell added that this result “doesn’t mark the beginning of a recession,” (2025). Others mentioned potential for economic uncertainty further down the line as more policy was unveiled. “Demand in the first quarter looks to be driven by businesses battening down the hatches before the storm,” Chief economist Luke Tiley of the Wilmington Trust said (2025).
One potential explanation for the GDP decrease is a phenomenon called the substitution effect, a phenomenon that suggests that the tariff induced frontloading substituted for domestic purchases. If this is the case, GDP would decrease since less money would be spent toward domestic production. This has been prevalent in the past as well.
In the 1990s, the Northern American Free Trade Agreement (NAFTA) contemplated potential tariff reductions. 96% such reductions were announced far in advance, giving consumers and firms the chance to act on this information ( Khan & Khederlarian 2021). A study found that in anticipation of an upcoming tariff reduction of 1%, imports dropped by a sizable 6% in the months before the tariff implementation when compared to regular months. The study used an Herfindahl-Hirschman Index, a method to measure market concentration, and applied it to the spread of imports. Their final result articulated that firms shift their purchases to periods when lower costs can be attainable and that these anticipatory dynamics are true (Khan & Khederlarian 2021).
A potential alternate explanation is that the small decrease in government expenditures was the key factor in the GDP decrease.
There are some potential gaps in data which limit the study of GDP accounting. For example, these accounting principles say nothing about potential causality with latent variables or economic impacts. There is also difficulty in GDP data collections since it can be difficult to only count final goods. Finally, GDP data could be fixed-weighted calculations that can add error as the economy changes and price structures evolve. However, when calculated in a chain-weighted approach to account for economic evolution, there are still struggles with new goods being added.
Methodology
This analysis uses monthly trade data and monthly effective tariff rates for the United States with its largest trading partners. It also uses the same data for the European Union to use as a control. The source for monthly trade data values were the U.S. Census Bureau and Eurostat. The effective tariff rate values were gathered from trusted sources and reflect prior US tariffs and changes as newer tariffs went into effect. This analysis employs a linear regression test with net trade balances and effective tariff rates to analyze the potential correlation between the two.
Results
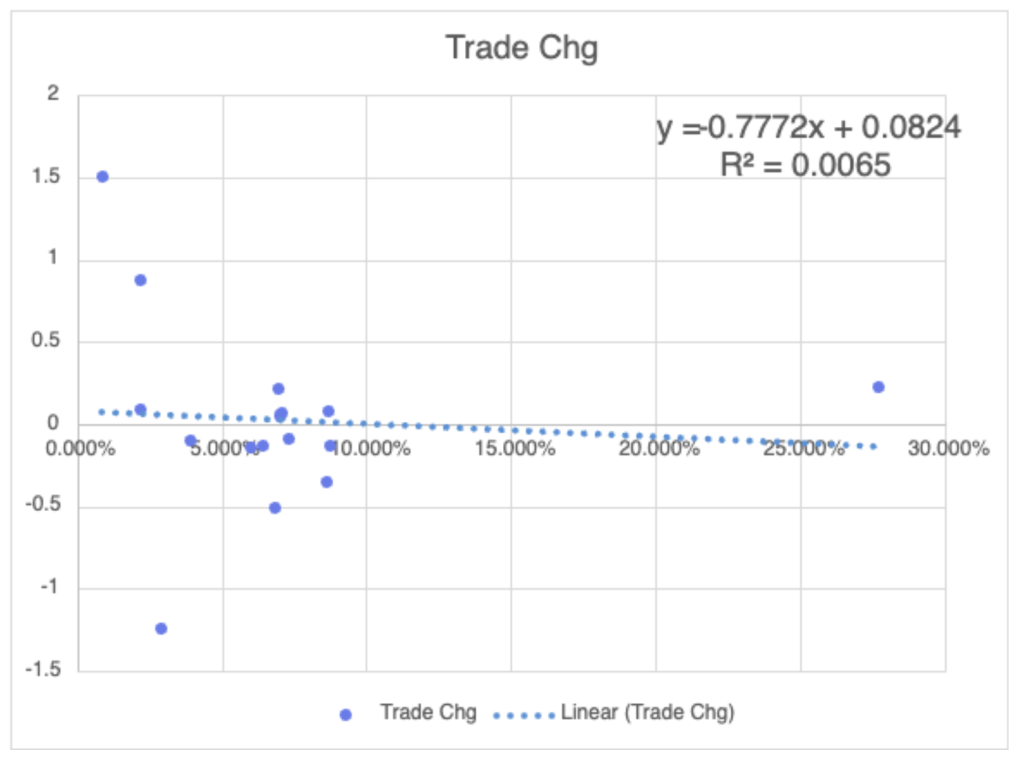
The data shows a minimal negative relationship between tariff rate and change in trade balances. This means that since the tariffs went into effect, there hasn’t been a significant increase or decrease in U.S. trade balances with main trading partners. The correlation coefficient was 0.0806 which confirms that in the three months since the tariffs went into effect, there weren’t any significant changes in trade balances that were caused by the changes in effective tariff rates. The coefficient of determination is 0.0065, or approximately 0, which meant that any changes that did occur in trade balances were not from the changes in effective tariff rates. Finally, the t-score value equals 0.0977 and indicates that the observed result aligns with the null hypothesis and the difference between the sample data and the population data is not statistically significant.
Discussion
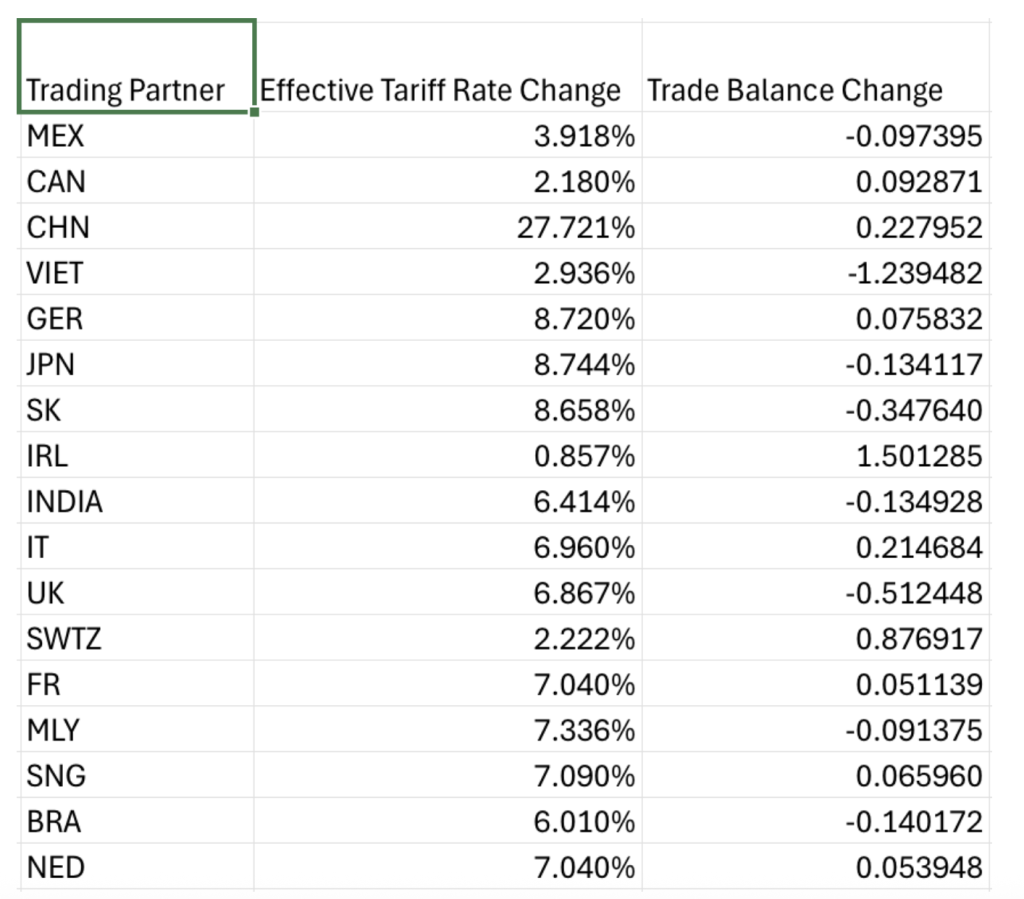
Ultimately, the analysis proves that there is no correlation between the vast increases in effective tariff rates and changes in net trade balances. By contrast, as shown in Table 2, the U.S. trade deficits actually became larger for some countries such as Vietnam or the United Kingdom despite increases in effective tariff rates. Other countries such as China or Italy faced similar decreases in trade deficits despite having large differences in net trade and change in effective tariff rates. Furthermore, some countries were levied with larger tariffs than others, making predicting the change in trade balances harder to anticipate.
A potential explanation for the results of the analysis is the extreme volatility in tariff policy during the study period. Following the implementation of the “Liberation Day” reciprocal tariffs in early April, several countries experienced rapid and significant changes in their tariff rates. For example, China briefly faced tariff levels exceeding 140%, while Brazil was subjected to a 50% tariff following political disputes with the U.S. administration. In addition to these enacted measures, frequent public threats of new tariffs introduced further uncertainty into global trade markets. Simultaneously, reports of partial or full trade agreements with major partners like the EU, China, Japan, and South Korea, led to subsequent reductions in effective tariff rates. This pattern of escalation followed by negotiated de-escalation likely diluted the measurable macroeconomic impact of tariffs, complicating attempts to identify stable relationships between tariff levels and trade or GDP outcomes.
Another potential reason can be shown through the pressures of the markets. Financial Times commentator Robert Armstrong coined the current administration’s trade policies as “TACO Trade”. The acronym refers to some of the administration’s sudden reversals of tariffs. Armstrong coined the term when describing the pattern of placing large tariffs on countries which led to economic panic, shock, and stock market hits. He then explained how later reversals of these tariff policies have led to market comebacks. Additionally, the market uncertainty can be explained as how stocks look like they are trending upward and then stop due to a social media post or claim by the government. It’s possible that many firms and businesses believed that the tariff rate changes wouldn’t be in place long term and thus, no changes were found in the U.S. trade balances.
Implications for Policy and Future Research
Investigating the nuanced economic effects on GDP is key for future policy regarding tariff measures and potential trade deals. As occurred in Q1, there are potential short term distortions in GDP measurement so it’s important to keep these in mind. An area for future research is on the study of tariffs-driven import behavior and with the substitution effect’s prominence in the short and long term. This would provide key insights into how firms react to the government policy and how both parties can better facilitate economic policy.Finally, it’s important to continue to analyze changes in trade balances to see if significant changes will be present with the passing of time and more recent data.
Works Cited
Al Hemzawi, B., & Umutoni, N. (2021). Impact of Exports and Imports on the Economic Growth. MSc. Thesis, Jönköping University. Buckling up for a long ride: chief economists add detail to a downbeat outlook. (2025, May 28). World Economic Forum. https://www.weforum.org/stories/2025/05/wef-chief-economists-uncertainty-global-outlook
Burns, T. (2025, June 26). US economy shrank faster than expected, new data shows. The Hill. https://thehill.com/business/5371005-us-gdp-revised-lower-consumer-spending
Conerly, B. (2025, March 11). Understanding GDP: Why Imports Don’t Actually Reduce Economic Growth. Forbes.https://www.forbes.com/sites/billconerly/2025/03/11/understanding-gdp-why-imports-dont-actually-reduce-economic-growth/
Daco, G. (2025, May). LinkedIn. https://www.linkedin.com/posts/gregorydaco_inflation-fed-fomc-activity-7323335677599793152-c–l/
Freund, C., Pierola, M. D., & Rocha, N. (2021). How Does Trade Respond to Anticipated Tariff Changes? Evidence from NAFTA (Policy Research Working Paper No. 9561). World Bank. Gross Domestic Product, 1st Quarter 2025 (Third Estimate) | U.S. (2025, June 25). Bureau of Economic Analysis. https://www.bea.gov/news/2025/gross-domestic-product-1st-quarter-2025-third-estimate-gdp-industry-and-corporate-profits
Khan, M. Y ., Akhtar, S., & Riaz, S. (2019). Dynamic Relationship Between Imports and Economic Growth in Pakistan. Journal of Economics and Sustainable Development, 10(10), 70–77.
Lemieux, P. (2018, September 6). The St. Louis Fed on Imports and GDP. Econlib. https://www.econlib.org/imports-as-a-drag-on-the-economy/
Mankiw, N. G. (2001). Principles of Economics. Harcourt College Publishers.
Saunders, P.J. (2010). A Time Series Analysis of the Role of Imports in India’s Phenomenal Economic Growth. Indian Journal of Economics and Business, 91, 101-109.
Schonberger, J. (2025, April 30). Shrinking GDP and elevated inflation put Fed in tough spot. Yahoo Finance. https://finance.yahoo.com/news/shrinking-gdp-and-elevated-inflation-put-fed-in-tough-spot-142211609.html
Sekara, D., Dzuibinski, S., & Caldwell, P. (2025, July 16). Morningstar’s Q3 2025 US Market Outlook: Has the Storm Passed, or Are We in the Eye of a Hurricane? Morningstar. https://www.morningstar.com/markets/morningstars-q3-2025-us-market-outlook-has-storm-passed-or-are-we-eye-hurricane
Srikant, K. (2025, May 14). Fact Check: Does an increase in imports directly reduce GDP? Econofact.https://econofact.org/factbrief/fact-check-does-an-increase-in-imports-directly-reduce-gdp
Wiseman, P., & Rugaber, C. (2025, April 29). U.S. economy shrinks 0.3% in first quarter as Trump tradewars disrupt businesses. AP News.https://www.ap.org/news-highlights/spotlights/2025/u-s-economy-shrinks-0-3-in-first-quarter-as-trump-trade-wars-disrupt-businesses/
Wolla, S. A. (2018, September 4). How Do Imports Affect GDP? | St. Louis Fed . Federal Reserve Bank of St. Louis. https://www.stlouisfed.org/publications/page-one-economics/2018/09/04/how-do-imports-affect-gdp
About the author

Ishaan Bafna
Ishaan Bafna is a 12th grade student at Kingswood Oxford School with strong academic and research interests in economics and mathematics. Ishaan actively pursues opportunities that integrates analytical thinking with critical reasoning and problem-solving. Known for his intellectual curiosity and work ethic, Ishaan wishes to pursue a career at the intersection of economics, mathematics and technology.
Outside of the classroom, Ishaan is a leader of his schools Math Team and Mock Trial Team, a lead peer tutor, and a varsity golf athlete. Ishaan has interned with The Hartford Insurance as a Lean Portfolio Management Intern. He is also a National Merit Commended Scholar and a recipient of various awards at his school.