

Author: Bodie Jenkins
Mentor: Torin Mark
Culver City High School
Abstract
This study examines whether teenagers use social media primarily for active communication or passive consumption. Screen time data from 29 teenagers revealed that 85.6% of usage was passive, compared to 14.4% active. Interviews indicated boredom and habit to be major factors in usage. These findings suggest that social media platforms originally designed for communication, are predominantly entertainment-oriented and signal a shift in how and why teenagers engage with social media.
Introduction
Social media began with SixDegrees in 1997, the first platform to combine user profiles, messaging, and friends lists: concepts still central to social media today. LinkedIn, Myspace, and Facebook followed, all focused on building personal or professional connections. But from 2005 to 2010, the platforms shifted: YouTube let anyone share videos, Instagram centered on photos, and in the 2010s Snapchat and TikTok introduced disappearing messages and algorithmic, infinite-scroll feeds. This is where the transition emerged: social media, originally designed to connect people, began to isolate them.
This shift shows up clearly in how much time teenagers now spend on these platforms. A 2023 survey found that U.S. teenagers spend an average of 4.8 hours per day on social media specifically (Gallup, 2023), and a separate study of teens and young adults found average daily screen time overall, across all apps, to be 6.54 hours (Gashaj, 2025).
TikTok’s structure was mirrored by other platforms, including Instagram Reels, Snapchat Spotlight, and YouTube Shorts, all converging on one consistent component: short-form content. A 2026 analytics review found TikTok’s 15-30 second videos have the highest engagement rate of any length bracket, 6.00% (Cucu, 2026), reflecting a decades-long trend of shrinking content length. Dopamine-scrolling, driven by mechanisms like suggestions, auto-play, pull-to-refresh, and infinite scrolling, keeps users continuously moving through a personalized feed to trigger dopamine releases. This endless scrolling has been linked to anxiety, depression, and lower self-esteem (one quasi-experimental study of Facebook’s staggered college rollout found it caused roughly 300,000 additional depression cases among 17 million U.S. college students, Doucleff, 2023), and can interfere with sleep schedules, compounding these effects. Yet social media has possible benefits too: 81% of teens feel more connected to friends’ lives, and roughly two-thirds feel they have people who support them through tough times (Pew Research Center, 2018). Rather than investigating these psychological effects directly, this study examines how teenagers actually use social media, specifically whether their time is spent on active social interaction or passive content consumption.
Therefore, this experiment isolates more than social media usage as a whole, but how social media is being used specifically. There are two major types of social media use, categorized as active and passive use. Active use involves communicating, commenting, and interacting with others. Passive use involves scrolling and viewing profiles without interacting. The Uses & Gratifications (U&G) Theory claims that users are actively selecting and using media based on their specific preferences and needs. The users choose the form of media that will serve their desired purpose (e.g., information, relaxation, communication). This perspective brings forth the idea that all forms of social media are somewhat active. For the purpose of this study, active use is used as a proxy for “social” interaction, while passive use is used as a proxy for “non-social” content consumption.
The background of our research lies in the significant alterations to social media platforms. Platforms that were solely used for connection now have extensive features that facilitate isolation. So the question that underlies the hypothesis is, “Is social media still social?” The question is aimed primarily at teenagers because they consume significant amounts of content through scrolling: 61% of teens use TikTok daily, compared with just 24% of all U.S. adults (Pew Research Center, 2025a, 2025b). Our hypothesis is that social media has become more of an entertainment platform than a connective one, with teenagers spending more time consuming content passively than interacting actively with others.
Previous research suggests that active use may provide more benefits, such as increased social connection, whereas passive use may be associated with negative effects such as isolation, depression, anxiety, and body dysmorphia.
Literature Review
The Dopamine Mechanism Behind Scrolling
A 2025 review in Cureus outlines the dopamine-driven feedback loop behind social media addiction (De et al., 2025). Peer influence and the pursuit of validation draw teenagers deeper into social media, where infinite-scrolling and algorithmically driven content take over. The mechanism runs through the mesolimbic system, the brain’s reward pathway: dopamine release makes scrolling feel rewarding, though it isn’t true happiness, just a chemical shortcut. As users build tolerance, they need more stimulation to feel the same reward, and personalized feeds are built to supply it: every like, follow, and swipe teaches the algorithm what will hold that user’s attention longest. This context-switching carries a measurable cost: short-form video specifically, unlike longer platforms like YouTube, has been shown to impair people’s ability to remember and follow through on their own intentions (Chiossi et al., 2023).
The Godard & Holtzman (2024) Meta-Analysis
A meta-analysis was conducted in 2024 (Godard and Holtzman, 2024) of 141 studies, in which they attempted to determine whether ASMU and PSMU had differing effects on users. The majority of effects were lower than the researchers’ threshold for a meaningful effect. However, one significant and consistent effect was that active use led to online social support (r = .34), with roughly 97% of the studies concurring. Despite most PSMU effects being below the threshold, some were worthy of note. Social anxiety symptoms (r = .29) were more prevalent due to PSMU. However, the data for social anxiety symptoms was gathered from only 3 of the 141 studies. PSMU was also found to be linked to greater illbeing, though the association was rather weak (r = .11).
This meta-analysis found adolescents and emerging adults show more negative passive-use associations than adults, which is why we chose to study the 16-18 age range specifically.
Research Question
To what extent do teenagers use social media for active social interaction compared to passive content consumption?
This paper investigates beyond total screen time: we gather screen time data, isolate social media usage, and break it into two categories, active and passive. Messaging others, including sending videos or photos directly to a friend, is recorded as active use, a deliberate act of communication directed at a specific person. Scrolling or viewing profiles without interacting is recorded as passive use. We record data for Instagram, TikTok, and Snapchat, three of the most-used platforms among teenagers. YouTube is excluded because most teenagers use it for longer videos rather than messaging.
Procedure
Data collection had two parts: a quantitative phase for every participant (n=29), and an optional interview (n=21). In the quantitative phase, after consent, each participant reported gender, age, and state, then opened their phone’s Screen Time tool so we could record total phone and social media time. We then navigated to their TikTok and/or Instagram and manually counted messages to record as active, with their permission. We asked whether each subject used Snapchat Spotlight, Snapchat’s scrolling feature, since Snapchat was otherwise coded as active.
We assumed each message or video took approximately 30 seconds to send, a figure chosen after timing one person reading and typing a 9-word reply (5-60 seconds). This 30 second estimate is likely a slight overestimate, since videos are often sent without opening the thread, but the difference is marginal and there’s no way to pin down a fully consistent messaging time. We used the previous day’s data throughout, to stay consistent with the daily figures gathered earlier.
But some willing participants contributed further by consenting to a recorded interview process. Questions varied slightly between conversations but they centered around the participants’ feelings regarding their social media usage. Not every participant was explicitly asked each question, as some were answered through previous answers. The core questions asked were:
- Looking at your Screen Time numbers, is this about what you expected? What, if anything, surprises you?
- If we pulled the same numbers from about three years ago, what do you think they would have looked like in comparison?
- When you first started using your main social media platform, what did you mostly use it for, and do you think that use has changed since then?
- How do you feel about the amount of time you spend on social media overall?
- When do you think you use social media the most?
- How do you usually feel after using social media?
- Do you procrastinate, and if so, do you think social media plays a role in it?
- What do you think you would do more of if social media did not exist?
Results & Discussion
Overall Usage
From the data, there was a large and consistent gap between passive and active usage of social media, with passive usage far exceeding active in time spent. Interviews also revealed that people don’t go on social media for a reason: most describe a trigger rather than a purpose.
As referenced in the intro, a recent study found the average daily screen time in adolescents to be 6.54 hours (Gashaj, 2025), and another study found the average adolescent daily social media time to be 4.8 hours (Gallup, 2023).
This study found similar results: average screen time across all 29 participants was 6h 31m (SD 2.62), and average social media time was 3h 22m (SD 1.45), likely lower than Gashaj’s figure because this study excludes YouTube, counting only Instagram, TikTok, and Snapchat.
Active vs. Passive: The Core Finding
Results show a consistent gap between active and passive usage: 27 of 29 (93.1%) participants’ majority SMU was passive, and only 2 of 29 (6.9%) were majority active, meaning they spent more time messaging than scrolling. The mean per participant was 14.4% active, 85.6% passive.
Passive usage is closer to consumption, like watching TV, than interaction; even liking and following are shallow, one-sided gestures. As established in the Introduction, we treat active use as “social” and passive use as “isolated” (proxies for answering our research question). Under that framing, social media is only 13.37% “social”: of 684.5 total hours collected, just 91.5 were spent actively messaging or sharing. Whether measured in pooled hours or per-person average (14.4%), the answer is largely the same: social media is not very social.
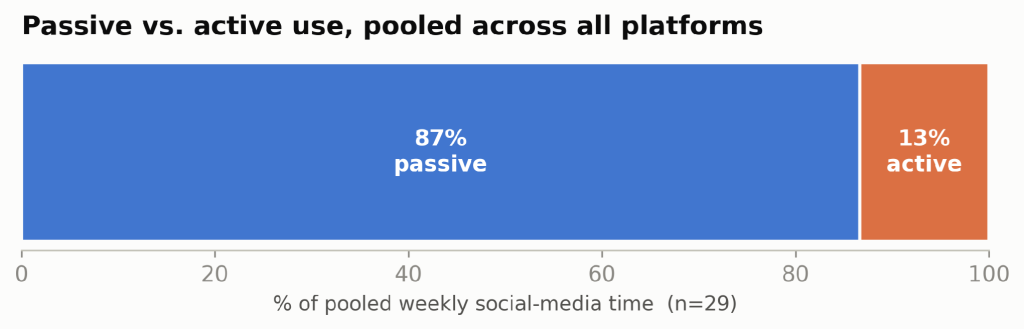
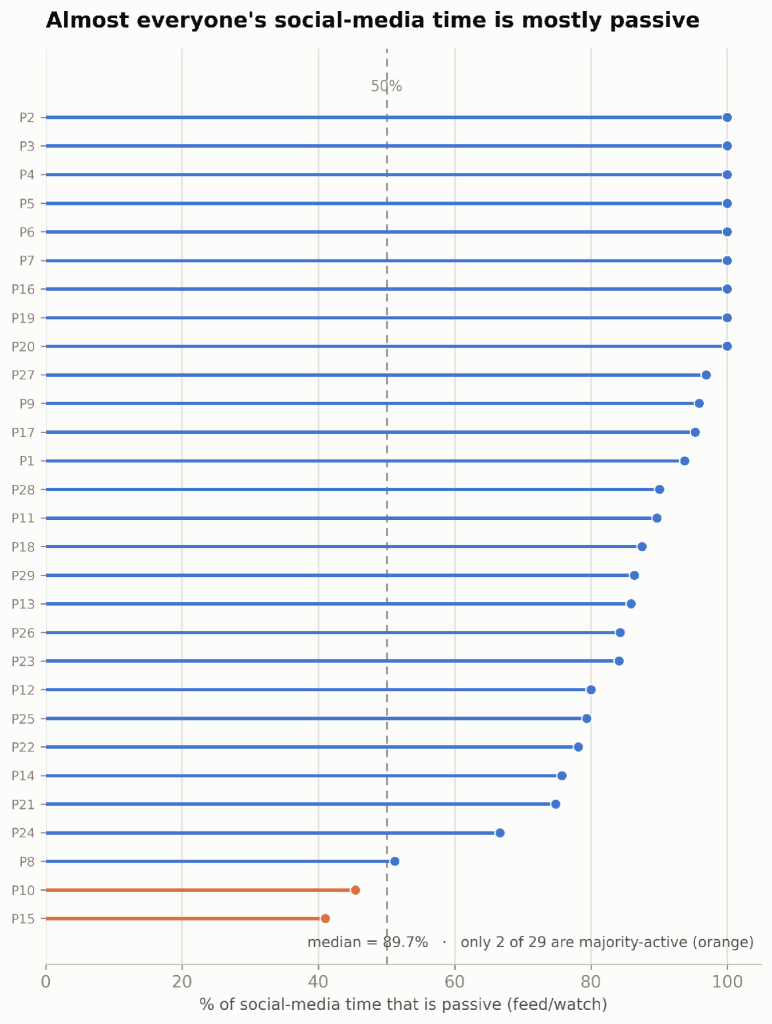
Figure 2. The same split, person by person rather than pooled, showing this isn’t a few heavy users skewing the average. Median is 89.7% passive, and only 2 of 29 participants are majority-active.
The Two Active Outliers
P15 and P10 are the only two participants whose majority SMU was active (59.0% and 54.6%, respectively), both because Snapchat, not TikTok, is their top app, and this study codes all Snapchat time as active by default. Neither sent an unusually high number of messages that week (P10: 5, P15: 6, both below average).
P15 describes a deliberate shift toward calling and texting friends instead of passively scrolling, consistent with his data. P10 describes a self-imposed screen time limit and his total usage is the lowest in the sample (849 minutes/week).
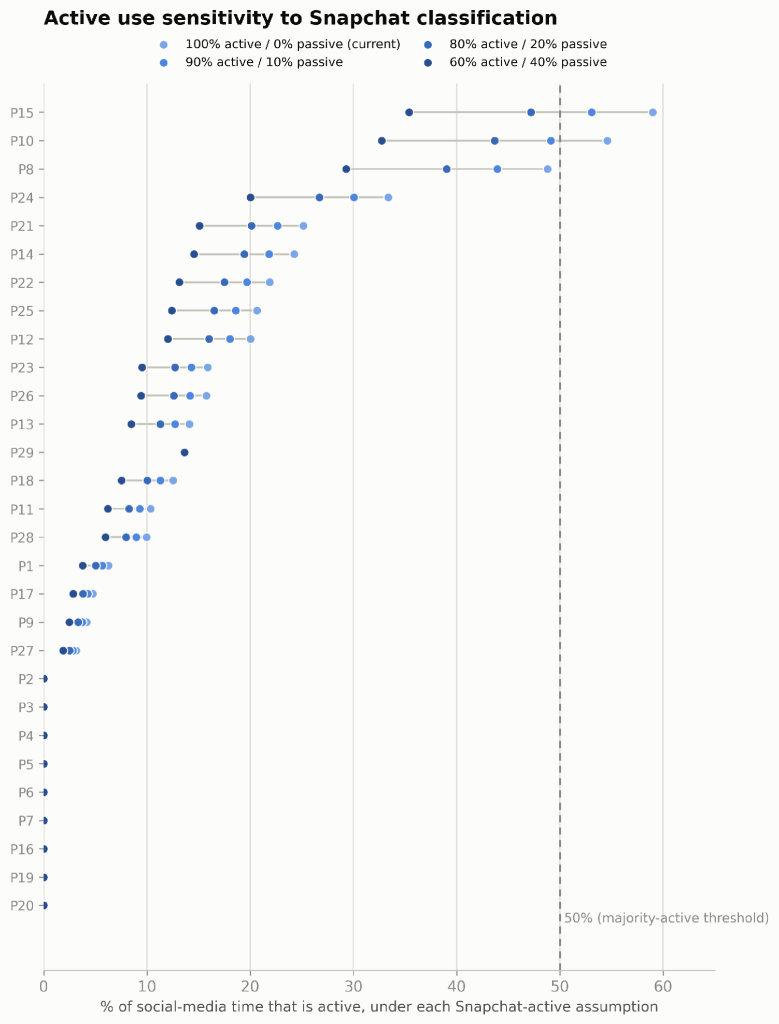
Because both outliers depend on Snapchat being counted as 100% active, Figure 3 tests how the sample’s active share shifts under three more conservative assumptions (90%, 80%, 60% active).
Platform Breakdown
This Screen Time data breaks down social media use per app. There are a few patterns worth noting regarding the different apps. TikTok dominates overall with 56.1% of all social media time across the sample. Instagram has 30.8% of the time and Snapchat has 13.1%. TikTok holds as the primary “top” or most-used social media app for 20 of 29 participants (69.0%).
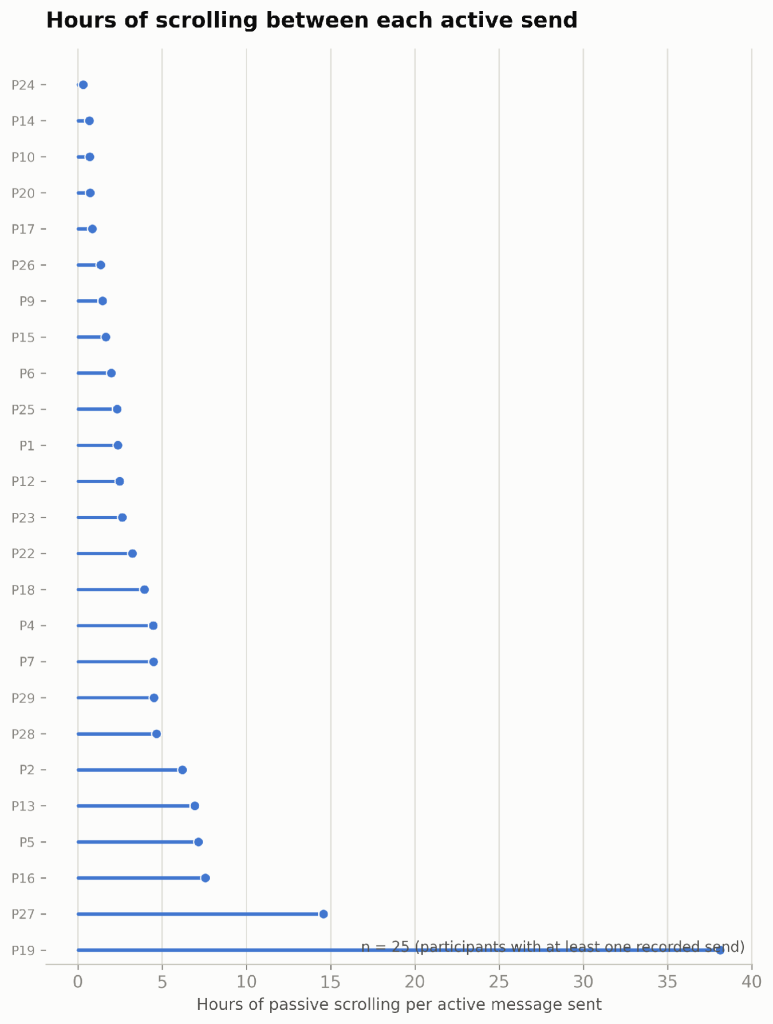
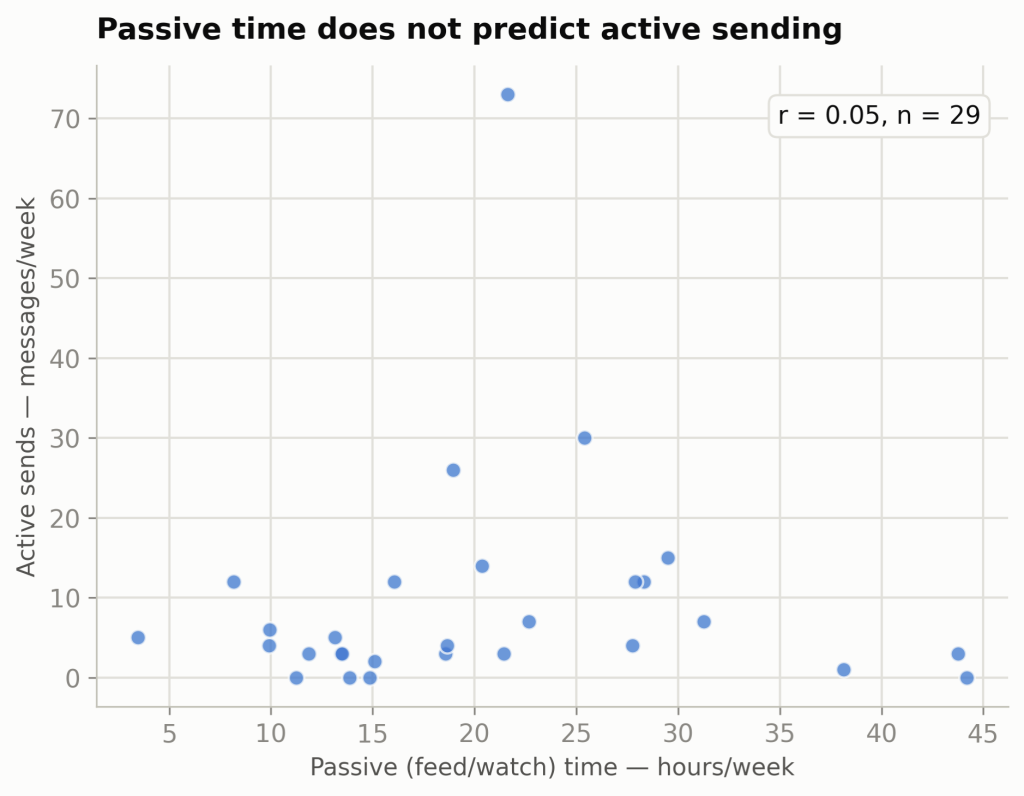
The Boredom / Gap-Filling Trigger
Of the 20 interviewed participants who answered when they use social media most, all 20 (100%) described an empty or unoccupied moment: boredom, a gap between tasks, or routine downtime before bed, with nighttime the single most common trigger (40%). Separately, 33% (7 of 21) used the word “bored” themselves, unprompted. This pattern corroborates that social media is replacing boredom and empty space.
This presents an interesting perspective on the U&G theory discussed in the Introduction. U&G claims that people have a specific desire when they use media; however, this repeated use in gaps and empty space suggests otherwise.
It seems that most participants didn’t think they had a reason for scrolling on social media; it was more accurately a force of habit. This illustrates a weakness in the U&G theory: habitual use can erode the autonomy people are assumed to have over their own media use, since habits are automatic behaviors rather than deliberate choices (LaRose, 2010).
This interpretation of the theory posits that social media is far more passive than previously believed.
Procrastination and Displaced Activity
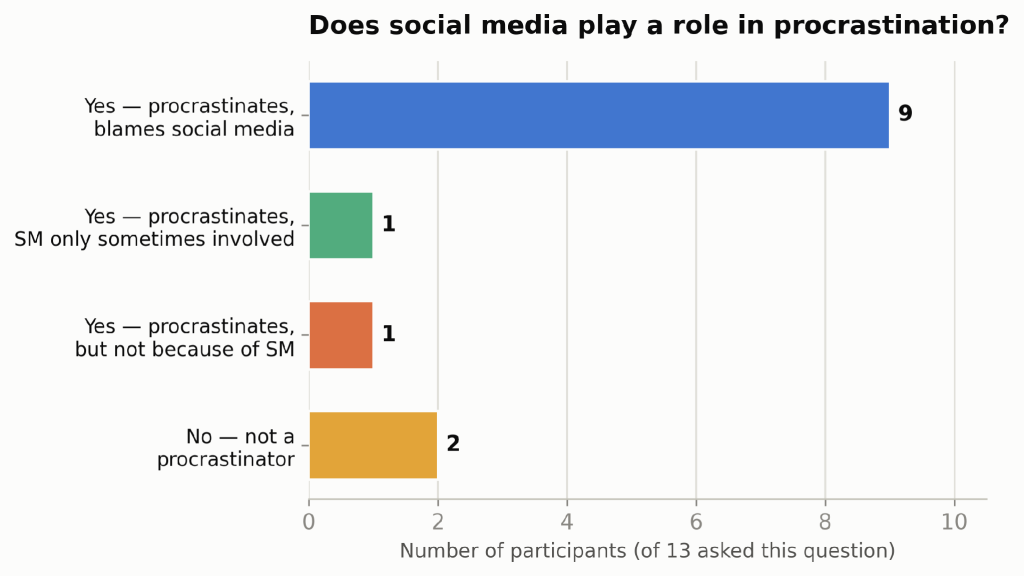
Of 13 participants asked whether social media plays a role in their procrastination, 11 said they procrastinate, and 9 of those directly blamed social media.
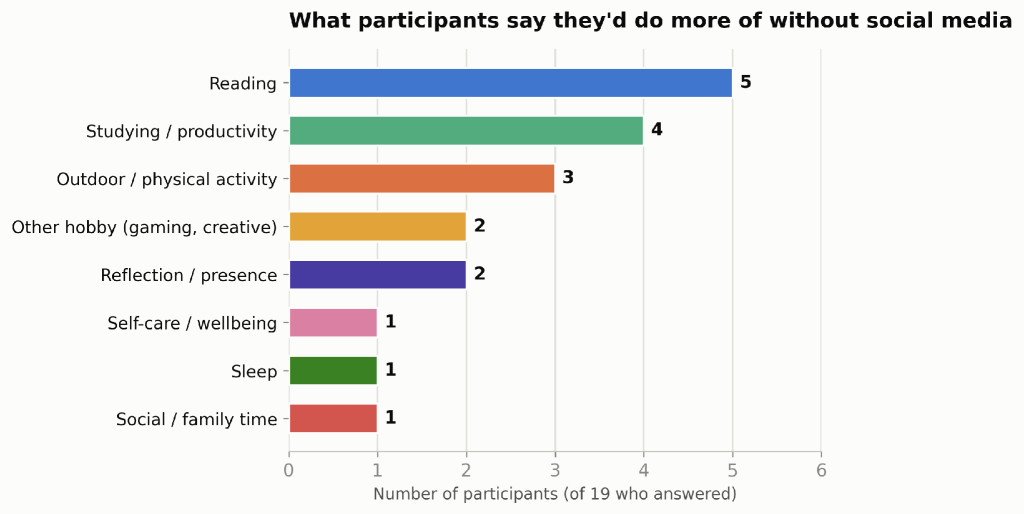
Separately, 19 participants named what they’d do more of without social media: reading was most common (5 of 19), followed by studying (4) and outdoor activity (3). No one said the time would simply sit empty: every answer named a specific, often more effortful activity, suggesting social media displaces effortful activity with a low-effort default. This only partly matches experimental displacement research: when people are actually deprived of social media, free time shifts toward browsing, chores, and work, not the more aspirational activities people predict for themselves (Hall, Johnson, and Ross, 2019).
Limitations
This study’s sample skews toward 17-year-olds: of all 29 participants, 79.3% were 17, 17.2% were 16, and 3.4% were 18, so it may not generalize evenly across the 16-18 range, even though every participant falls within it.
Some interview questions relied on retrospective self-report and recall, for example, “If we’d pulled these same numbers three years ago, what do you think they’d have looked like?”
This study also has three broader design limitations. The sample is a convenience sample, drawn significantly from one school and one state, not randomly selected, so it may not represent teenagers more broadly. The design is correlational: it can show that passive use and certain outcomes move together, but it cannot establish that one causes the other. And the screen-time data covers a single week per participant, which may not reflect a typical week, since school breaks, exams, or other unusual circumstances could skew an individual week’s numbers.
Because 0% of participants reported using Snapchat Spotlight (its scrolling feature), Snapchat was coded as 100% active, though some Snapchat use (swiping through Stories) is really passive and wasn’t easily separable in this study. This matters: if Snapchat were 80% active, no participants would have had majority ASMU, and at 60% active, the study’s overall active share would drop from 13.4% to 8.1% (see Figure 3).
This study also excludes YouTube, the fourth most-used platform among teenagers: in a February 2026 trial, YouTube’s own attorney argued it “isn’t a social media app… but rather a streaming channel, like Netflix or Disney+” (Aron, 2026). YouTube is almost entirely passive, so including it would likely only raise the passive share found here: a 2019 Pew analysis found the average YouTube video was about 12 minutes long, with only 3% exceeding an hour (Pew Research Center, 2019).
Conclusion
This study intended to answer the question of whether “social media is still social”. Overall, the findings in this study show that the answer is mostly no. Social media usage among teenagers is primarily a passive activity, with consumption greatly outweighing communication. This data is interpreted to mean that social media itself is more isolated than social. Furthermore, this study records 95% (20 of 21) of interviewed participants attributing their SMU to boredom, or a gap with nothing else to do. Participants described reaching for social media out of boredom or routine, not a specific communicative purpose, which weakens the assumption at the center of Uses and Gratifications Theory that media use is a deliberate, need-driven choice. Once that choice becomes a habit, it stops functioning as a choice at all (LaRose, 2010).
These results lead to the next research question, which is whether the action of using social media itself is an active choice anymore. Recent legal developments have indicated that the design of social media platforms is addictive (NPR, 2026). With the erosion of choice, and the addictive power of social media, it brings into question how active of a choice it is to use social media; whether it is autonomous or automatic.
References
Aron, Hillel. “‘It’s Not an Addiction’: YouTube Pushes Back in Landmark Social Media Trial.” Courthouse News Service, 10 Feb. 2026, www.courthousenews.com/its-not-an-addiction-youtube-pushes-back-in-landmark-social-media-trial/.
Chiossi, Francesco, Luke Haliburton, Changkun Ou, Andreas Butz, and Albrecht Schmidt. “Short-Form Videos Degrade Our Capacity to Retain Intentions: Effect of Context Switching on Prospective Memory.” Proceedings of the 2023 CHI Conference on Human Factors in Computing Systems, 2023, article 253, doi:10.1145/3544548.3580778.
Cucu, Elena. “Best TikTok Video Length in 2026: What the Data Shows.” Socialinsider, 10 Jul. 2026 (updated 21 Jul. 2026), www.socialinsider.io/blog/how-long-are-tiktok-videos/.
De, Debasmita, Mazen El Jamal, Eda Aydemir, and Anika Khera. “Social Media Algorithms and Teen Addiction: Neurophysiological Impact and Ethical Considerations.” Cureus, vol. 17, no. 1, 8 Jan. 2025, e77145, doi:10.7759/cureus.77145.
Doucleff, Michaeleen. “The Truth About Teens, Social Media and the Mental Health Crisis.” NPR, 25 Apr. 2023, www.npr.org/sections/health-shots/2023/04/25/1171773181/social-media-teens-mental-health.
Gallup News. “Teens Spend Average of 4.8 Hours on Social Media Per Day.” Gallup, 13 Oct. 2023, news.gallup.com/poll/512576/teens-spend-average-hours-social-media-per-day.aspx.
Gashaj, Ariela. “Analysis of Social Media Addiction in Teens and Young Adults: A Recommendation Report.” Undergraduate Journal of Public Health, vol. 9, 2025, doi:10.3998/ujph.7607.
Godard, Rebecca, and Susan Holtzman. “Are Active and Passive Social Media Use Related to Mental Health, Wellbeing, and Social Support Outcomes? A Meta-Analysis of 141 Studies.” Journal of Computer-Mediated Communication, vol. 29, no. 1, 2024, article zmad055, doi:10.1093/jcmc/zmad055.
Hall, Jeffrey A., Rebecca M. Johnson, and Elaina M. Ross. “Where Does the Time Go? An Experimental Test of What Social Media Displaces and Displaced Activities’ Associations with Affective Well-Being and Quality of Day.” New Media & Society, vol. 21, no. 3, 2019, pp. 674-692, doi:10.1177/1461444818804775.
LaRose, Robert. “The Problem of Media Habits.” Communication Theory, vol. 20, no. 2, 2010, pp. 194-222, doi:10.1111/j.1468-2885.2010.01360.x.
NPR. “Jury Finds Meta and Google Negligent in Social Media Harms Trial.” NPR, 25 Mar. 2026, www.npr.org/2026/03/25/nx-s1-5746125/meta-youtube-social-media-trial-verdict.
Pew Research Center. “A Week in the Life of Popular YouTube Channels.” Pew Research Center, 25 Jul. 2019, www.pewresearch.org/internet/2019/07/25/a-week-in-the-life-of-popular-youtube-channels/.
Pew Research Center. “Americans’ Social Media Use 2025.” Pew Research Center, 20 Nov. 2025a, www.pewresearch.org/internet/2025/11/20/americans-social-media-use-2025/.
Pew Research Center. “Teens’ Social Media Habits and Experiences.” Pew Research Center, 28 Nov. 2018, www.pewresearch.org/internet/wp-content/uploads/sites/9/2018/11/PI_2018.11.28_teens-social-media_FINAL4.pdf.
Pew Research Center. “Teens, Social Media and AI Chatbots 2025.” Pew Research Center, 9 Dec. 2025b, www.pewresearch.org/internet/2025/12/09/teens-social-media-and-ai-chatbots-2025/.
About the author
Bodie Jenkins
Bodie Jenkins is a high school senior from Culver City, California. He is deeply involved in Model Government and promoting civic engagement and has spent time debating on a statewide and national level, representing California at conferences.
This research paper was inspired by a topic Brodie debated during a statewide campaign for Youth Governor of California Youth and Government. The question regarded the regulation of algorithms in social media for youth. This debate propelled him to start a podcast Public Hearing with Bodie Jenkins to evaluate the positive and negative effects of social media, and the legal rulings surrounding it.
Following his research, Brodie couldn’t help but notice how much time his peers, and even he, spent on social media. Additionally, following the COVID-19 pandemic, Brodie began noticing what seemed to be increased social anxiety and discomfort in face-to-face interactions among his peers. These observations led Brodie to question whether social media, despite its promise of connection, might also contribute to feelings of social isolation. This question ultimately inspired his research project.