

Author: Yu Tung Hua
Mentor: Dr. Sadegh Asgari
Dulwich College Shanghai Pudong
Abstract
Bridges being tightly linked to public safety, inspections of their conditions are crucial to conduct immediate rehabilitation or replacement. However, they are often resource-intensive and difficult to scale given the number of bridges in a state. This study explores the use of machine learning models to predict the overall condition of bridges in Massachusetts using publicly available data from both the Massachusetts Department of Transportation (MassDOT) and the National Bridge Inventory (NBI). Building upon prior studies in infrastructure analytics, this research offers a novel contribution by applying a multiclass classification framework to bridge condition prediction using state-level datasets. Seven multiclass classification algorithms were tested, including Random Forest, XGBoost, and Multi-Layer Perceptron on up to 7,232 bridge records. Among them, XGBoost achieves the highest accuracy, precision, recall, and F-1 score (82.99%, 81.10%, 64.38%, 68.29 % respectively). These findings suggest that Machine Learning models can support state agencies in prioritizing bridge inspections and allocating resources more efficiently; additionally, understand the importance of features, such as age and span of the bridge. However, it is worth noting that both datasets are limited in different ways: size of the data and the number of predictive features, as well as the imbalance in NBI dataset. As this study focuses on Massachusetts, it would be generalizable to other statewide research; nevertheless, when the scope is the entire United States, variables like climate would influence the results.
1. Introduction
A. Background Information
As urban cities grow and need for transporting goods and services increase, the demand placed on bridges has exponentially increased, which intensifies the stress on supporting structures and the rate of deterioration. By 2024, 36% of US bridges are classified as having the need for replacement or rehabilitation, and 6.8% are classified as structurally deficient in poor condition (ARTBA Bridge Report). An example is the Francis Scott Key Bridge, which collapsed in March 2024 due to the lack of inspection on the truss and the overall condition of the structures, resulting in injuries and presumed deaths; the bridge collapsed on ship, which indefinitely blocked the passageway (Regan et al.). Therefore, regular maintenance of these bridges is vital to ensure the stability of the structures and prevent collapses; yet these processes require lots of resources and time allocated, causing them to be a great challenge for state and local governments.
Currently in the US, among more than 623,000 bridges, 49.1% are in the category of “fair” condition, and 44.1% are in “good” condition, and the rest 6.8% are in “poor” condition. The Infrastructure Investment and Jobs Act (IIJA) allocated approximately $40 billion for bridge investment and maintenance (Infrastructure Investment and Jobs Act | FHWA, 2022), yet this funding remains insufficient to address the needs of all U.S. bridges, especially given that over 36% require rehabilitation or replacement; according to ARTBA in 2023 (A Comprehensive Assessment of America’s Infrastructure, 2025), over $319 billion is needed to make all needed repairs, and ASCE estimated $191 billion for all rehabilitation (American Society of Civil Engineers, 2017), which shows the limited budget on bridge inspection. Hence, this stresses the need for precise location of the bridges that could potentially degrade from one “good” to “fair” or “fair” to “poor”, so that the limited budget will not be wasted on routinely checking bridges that do not have the potential to degrade, ensuring the efficient use of resources.
The main determinants of bridges’ rate of deterioration include bridges’ age, average daily traffic, bridge material, structure length, and deck area, which are reflected by their correlation with the overall conditions of bridges. A low-cost and efficient solution is to determine potential deterioration of bridges using existing data on the above bridge features without physical testing on the condition of bridges, which can accurately locate the bridges requiring maintenance, rehabilitation or replacement and substantially decrease the number of resources and time devoted to inspecting bridges in relatively good conditions if a comprehensive data set is provided by the state Department of Transportation. This study focuses on the bridges in the state of Massachusetts, with the bridge inventory published in 2025 by MassDOT; each bridge has an overall rating on a scale of 0-9 with a 0-8 rating for bridge deck, superstructure, and substructure conditions which are used as the predicted values of the machine learning models with the input of bridge features.”
B, Literature Review
A review of the existing literature on the machine learning approach to predict infrastructure conditions reveals a range of comparative research, optimization of previous models, and development of new models. Specifically, for bridge condition predictions, most researches use the properties of bridges included in the National Bridge Inventory (NBI), which consists of both structural properties of bridges and external elements, such as traffic and environment. The entire NBI contains 123 fields, with about 25 predictive fields of categorical and nominal data that’s directly collected during inspection that has linked to the bridge deterioration. To predict the next condition predict using nominal and categorical data from one year, algorithms like K-Nearest Neighbors (KNN), Random Forest Classifier (RF), Artificial Neural Network (ANN) were most used due to their ability to handle heterogeneous datasets and capture complex non-linear relationships between input features and structure conditions. In this literature review, multiple previous research on predicting bridge deterioration will be analyzed, so that this study can build upon their strengths and limitations.
In the study by Assaad et al. 2020, they aim to predict the specific condition ratings of the deck component in a bridge, as decks are directly exposed to the traffic pressure and weather and impact the usability of bridges more than other components. The Machine Learning algorithms ANN and KNN were trained upon ten fields in NBI selected by the Boruta algorithm and optimized by hyperparameter tuning and cross-validation. Overall, the ANN achieved 91.44% and KNN 89.99% accuracy rate. However, this high accuracy rate was likely caused by the use of superstructure and substructure condition ratings as a variable, which is calculated rather than tested, and could have direct correlation with the deck conditions (Assaad et al., 2020). Despite the limitations, this provides insights into the method to optimize the algorithms and the fields to use for prediction.
In another study by Mia & Kameshwar in 2023, similarly, they used a machine learning-based approach to predict the bridge deck, superstructure, and substructure components’ condition ratings of the bridge, ultimately reaching a highest accuracy rate of 93%-97% using a RUSBoost combined with Random Forest algorithm. The approach of this study to predict each component separately is proved successful as different features in the NBI impact each component differently. However, one issue in this study is how the data used is largely biased, without even number of bridges in each condition rating. This issue could be prevented by evening the dataset using bridges in different conditions; however, this could lead to a large reduction in data size, which would occur if only one US state’s bridge data nb is used. A notable aspect of this study is the uncertainty quantification, which simulates the variability in training due to different sampling of data, which demonstrates the reliability of using different algorithms consistently for this prediction.
Another research similar to this is an investigation done by Mohammadi et al. in 2023, in which they trained and tested different machine learning algorithms on predicting culvert conditions, which face similar deterioration as bridges, but more environmental impacts such as soil pH level etc. In this study, they tested Random Forest, ANN, Decision Trees, SVM, and KNN, and concluded Random Forest had the highest accuracy of 82%, as RF is particularly effective with a combination of numerical and categorical features; additionally, the age of the culvert was also found to be the most predictive feature. Also mentioned in the study, one key limitation of this study is to test newer classification algorithms. Since technology continuously advances, later models were expected to perform better than older ones like Random Forest. Therefore, in this study, models like XGBoost and RUSBoost are included.
One study on bridges in Ohio state by Nasab et al. in 2023 uses XGBoost, Random Forest, ANN, SVM, K-NN, Logistic regression and Decision Tree, with their accuracy, precision, recall, and F1 scores calculated. As a result, this study found XGBoost has the best performance with the highest score for all metrics, followed by Random Forest. It is discussed by researchers that XGBoost could handle the numerical and categorical features more effectively; also with the L1 and L2 regularization, it does not overfit with redundant data, unlike Random Forest, which has high training accuracy but lower testing accuracy. However, despite the rigorous testing of seven models, this study also only tested for predicting bridge deck conditions, which could lead to different results in the feature importance conclusions.
Apart from the performance and models, the importance of different bridge features is also a crucial knowledge this study tries to find and discuss, which is analyzed in a study by Fard and Fard in 2024, comparing three models’ performance in predicting deck condition of bridges. They tested and concluded that Age of the bridge is the most important feature, followed by climate regions, deck area, and ADT. Since this study specifically focuses on bridges in Massachusetts, climate regions will not be applicable. That said, having ADT as the fourth most important feature is highly relevant. In this study, all of the components and the overall condition are predicted and tested, and it is expected that ADT would influence different components differently; the conclusion made by Fard & Fard therefore suggests its strong correlation to the deck component.
All of the above studies focused on using normal classification algorithms. In the study by Liu & Zhang 2020, they attempt to predict condition ratings of bridge components using historical NBI data with a Convolutional Neural Network (CNN) model. Specifically, they used the Maryland and Delaware highway bridges from 1992 – 2017. Overall an 85-87% accuracy is achieved by the model. This is an entirely different approach compared to all the other studies mentioned earlier; nevertheless, it is seen that the accuracy score of CNN does not have much difference with the previous results. This is likely due to the lack of a large dataset that is cleaned and labeled to predict accurately. This attempt to use temporal forecasting rather than predicting using measured features of the bridge on one inspection could be applied to create a trend line of bridges’ deterioration, but providing the imperfect accuracy rate, perhaps such method would not be as effective and efficient compared to cross-sectional models utilized in this study.
One study that achieved an especially high accuracy rate is a study by Li and Song in 2022, which they focus on comparing ensemble machine learning models for predicting steel bridge deck defect conditions using NBI data from 2021. The models used were RF, Extra Trees, AdaBoost, Gradient Boosting, XGBoost, and LightGBM, concluding that XGBoost performed best with accuracy of 94.95%, AUC of 90.26%, Recall of 99.94%, Precision of 94.98%, and F1 Score of 97.40%. This score, though shows XGBoost high performance in predicting the bridge data, is caused by the test of binary classification, where they only examined the ability of the models to classify bridges into defective or non-defective classes, also with the use of condition ratings of superstructure and substructure. This therefore makes the study limited despite the insights it provides about ensemble machine learning models’ capabilities in this area of prediction.
Figure 1: Table of Bridge Components and Models Included in Previous Literature
| Author | Year | Component Tested | Model Tested |
| Assaad et al. | 2020 | Bridge Deck | K-NN, ANN |
| Mia & Kameshwar | 2023 | Bridge Decks, Superstructure, Substructure | RUSBoost based Random Forest |
| Mohammadi et al. | 2023 | Culvert | SVM, K-NN, DT, RF, ANN |
| Nasab et al. | 2023 | Bridge Deck | XGBoost, RF, ANN, SVM, K-NN, Logistic Regression, DT |
| Fard & Fard | 2024 | Bridge Deck | RF, XGBoost, ANN |
| Liu & Zhang | 2020 | Bridge Deck, Superstructure, Substructure | CNN |
| Li & Song | 2022 | Bridge Deck | RF, Extra Trees, AdaBoost, Gradient Boosting, XGBoost, LightGBM |
Figure 2: Table of the Most Important Features and Best Performing Model in Previous Literature
| Author | Year | Most Important Feature | Best Performing Model (Accuracy) |
| Assaad et al. | 2020 | Superstructure condition | ANN: 91.44% |
| Mia & Kameshwar | 2023 | Deck condition | RUSBoost-based Random Forest: 93%-97% |
| Mohammadi et al. | 2023 | Culvert Age | RF: 82% |
| Nasab et al. | 2023 | Bridge Age | XGBoost: ~87% |
| Fard & Fard | 2024 | Bridge Age | RF: 83.4% |
| Liu & Zhang | 2020 | Previous Condition Ratings | CNN: 85.4%-87.4% |
| Li & Song | 2022 | Superstructure Condition | XGBoost: 94.95% |
II. Methodology
A. Data Selection and Processing
The experimental process mainly lies in the selection of data and the implementation of various machine learning algorithms that are developed at different times and made with similar purpose but different ways.
Starting with data selection, for Massachusetts, there are two main source of collecting data of bridge properties and conditions: MassGIS Data Hub, a public dataset made by Massachusetts geoDOT, and the Massachusetts sub section in the National Bridge Inventory (NBI). The two datasets are in different formats and contain different fields, and therefore a comparison had to be made before processing the two datasets separately. In terms of number of fields, the CSV data from MassGIS Data Hub have 45 fields including non-predictive fields and information about the data collection itself. In terms of bridge count, 8152 rows are included in this dataset. Out of the 45 fields, there are only six useful fields that can be used, both numerical and categorical listed below:
Figure 3: List of Predictive Features in MassGIS Data Hub
| Field Number | Field Name |
| 1 | deckArea (numerical) |
| 2 | structureType (categorical) |
| 3 | typeOfService (categorical) |
| 4 | structureCategory (categorical) |
| 5 | structureLength (numerical) |
| 6 | structureMaterial (categorical) |
| 7 | yearsOld (numerical) |
The features listed above are only ones that are useful for this study, as some predictive fields were excluded as they are not applicable in a Massachusetts only context; for example, the longitude and latitude fields would be useful in a study of the entire United States as they can determine the climate zone of the bridges, but since Massachusetts as a whole lies in one climate zone, these fields are removed from the dataset. Moreover, to handle missing values, particularly for ADT, the rows with missing values or N were dropped, which is necessary to maintain consistency, although it resulted in a reduction in overall sample size. Furthermore, there are certain fields that could have a high correlation with the bridge components’ conditions but cannot be collected directly from bridges. For instance, superstructure condition ratings could have a very high correlation with deck condition ratings as shown by multiple other literature, but this field is already a calculated classification based on the features found in inspection. Therefore, only the six fields above are used for prediction. However, this dataset does not include every feature that impacts a bridge’s deterioration; more specifically, average daily traffic. Since the bridge mainly deteriorates when there’s a load on the bridge, the lack of such features would therefore lead to low accuracy scores. Hence, a solution to this problem is to add the ADT values from the NBI to this dataset by matching the bridgeDepartmentNumber in the MassGIS Data Hub dataset and the STRUCTURE_NUMBER_008 in the NBI. Since the two datasets do not contain the same number of bridges included, several bridges in MassGIS Data Hub have no corresponding ADT values in the NBI; therefore, after dropping all the rows including bridges without ADT values, a new dataset consisting 7232 rows is produced.
On the other hand, the NBI data is much more comprehensive in terms of number of fields included, with 123 fields. The data also includes 5312 rows, which is about 2000 short compared to the MassGIS Data Hub dataset. In all of the 123 fields, 27 fields are predictive to some extent. Within that, year built and year reconstructed are used to calculate the bridge’s age by subtracting the largest one of them form 2025; also, all of the categorical fields are transformed into binary fields as string is not an accepted data type by many machine learning algorithms implemented in this study. The complete list of fields used for prediction is listed below:
Figure 4: Predictive Features in NBI Dataset
| Field Number | Field Name | Specifications |
| Calculated | AGE (numerical) | Calculated by subtracting the largest between year built and year reconstructed from 2025 |
| 028A | TRAFFIC_LANES_ON (numerical) | Number of traffic lanes on the bridge deck |
| 029 | ADT (numerical) | Average Daily Traffic |
| 031 | DESIGN_LOAD (numerical) | Load the bridge was designed to carry |
| 032 | APPR_WIDTH (numerical) | Width of the approach roadway to the bridge |
| 035 | STRUCTURE_FLARED (categorical) | Whether the bridge widens at the ends |
| 043A | STRUCTURE_KIND (categorical) | Material of the main structure |
| 043B | STRUCTURE_TYPE (categorical) | Design of the bridge |
| 044A | APPR_KIND (categorical) | Material of the approach sections |
| 044B | APPR_TYPE (categorical) | Design of the approach sections |
| 045 | MAIN_UNIT_SPANS (numerical) | Number of spans in the main bridge |
| 046 | APPR_SPANS (numerical) | Number of spans in the approach sections |
| 047 | HORR_CLR (numerical) | Minimum horizontal clearance beneath or on the bridge |
| 048 | MAX_SPAN_LEN (numerical) | Length of the longest single section of the bridge |
| 049 | STURCTURE_LEN (numerical) | Total length of the bridge |
| 050A | LEFT_CURB (numerical) | Width of the left curb on the bridge |
| 050B | RIGHT_CURB (numerical) | Width of the right curb on the bridge |
| 051 | ROADWAY_WIDTH (numerical) | Usable width of the bridge roadway |
| 052 | DECK_WIDTH (numerical) | Width of the bridge deck including curbs and barriers |
| 053 | VERT_CLR_OVER (numerical) | Vertical clearance above the bridge deck |
| 103 | TEMP_STRUCTURE (categorical) | Whether the bridge is a temporary structure |
| 107 | DECK_STRUCTURE_TYPE (categorical) | Type of structure system used in the bridge deck |
| 108A | SURFACE_TYPE (categorical) | Material used for the bridge deck’s surface |
| 108B | MEMBRANE_TYPE (categorical) | Type of waterproofing membrane used in the bridge deck |
| 109 | PERCENT_ADT_TRUCK (numerical) | Percentage of ADT made up of trucks |
| 114 | FUTURE_ADT (numerical) | Predicted average traffic in the design year |
| Calculated | DECK_AREA (numerical) | Total area of the bridge deck (deck width * structure length) |
Given the large amount of predictive features in the NBI dataset and the different layout and amount of rows in the dataset from MassGIS Data Hub, testing the machine learning algorithms on both datasets would be a suitable attempt to double check the results on one dataset. In addition, using the Mass GIS Data Hub dataset with less predictive features included could also provide insight into how the models perform differently when the input features are limited, which could occur under budget limitations to inspection etc.; building on this idea, if a model could perform similarly well in limited conditions, perhaps it suggests the possibility to reduce the complexity and amount of inspection routines on bridges, which could significantly cut the budget needed to ensure bridge security and safety.
Then, the fields that will be predicted are the condition rating for each component of the bridge and the overall condition. In the MassGIS Data Hub data, the fields: deckCondition, superstructureCondition, and substructureCondition have rating system from 0-9; from 0-4 the component is classified as poor, 5-6 is fair, and 7-9 is good. The overallCondition only has three levels, 4, 6, and 9, which signifies poor, fair, and good. The score is based on the lowest rating within all components. For example, the lowest score is 5 from substructureCondition of a bridge, the overallCondition would be 6-fair. Similarly, in the NBI, DECK_COND, SUPERSTRUCTURE_COND, and SUBSTRUCTURE_COND also follow the same rating system, and the BRIDGE_CONDITION is calculated the same way but displayed as G-Good, F-Fair, and P-Poor. Though keeping the component ratings as 0-9 since it provides a more detailed prediction to help assess the bridges’ conditions; due to the imbalance between amount of bridges with each rating and the use of k-fold cross validation, there would not be sufficient amount of data to be used for each fold. Hence, the components are also categorized into Good, Fair, and Poor for the two datasets.
B. Implementation of Machine Learning Algorithms
After reviewing all the other literature of machine learning approach to predict bridge conditions, the following models are selected to be implemented and compared in this study:
Figure 5: List of Models Tested in this Study
| Name of the Model | Model Type | Year Introduced |
| Random Forest Classifier | Ensemble | 2001 |
| Extreme Gradient Boosting (XGBoost) | Ensemble | 2016 |
| Decision Tree Classifier | Tree-based | 1986 |
| k-Nearest Neighbors | Instance-based | 1951 |
| Logistic Regression | Linear Model | 1944-1958 |
| Multi-Layer Perception | Neural Network | 1986 |
| Support Vector Machine | Margin-based | 1995 |
| Random UnderSampling Boosting (RUSBoost) | Ensemble | 2009 |
The list of machine learning algorithms listed above covers multiple different types of models, as well as a long time span, which allows a rigorous comparison of their performance to be conducted.
To evaluate model performance, stratified K-fold cross-validation with five folds is employed to divide the entire dataset into five subsets of equal size, which each of which has the same proportion of bridge condition ratings as in the full dataset (ratio of good, fair, and poor bridges). In each iteration, four of the five folds are used to train the models, and the remaining one is used for testing. With this iteration repeating five times and averaging the score metrics across five runs can produce an unbiased estimation of the general performance of the models in predicting bridge conditions. The specific metrics used to measure the performance of the models are accuracy, precision, recall, and F1-score. Accuracy is a simple but most straightforward metric, which represents the overall proportion of correct predictions out of all the predictions made, calculated through the formula:
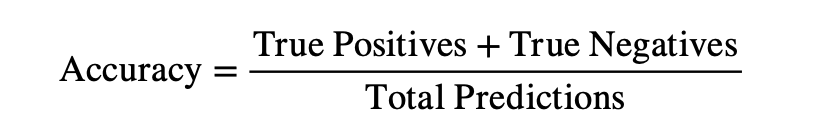
This score gives a general overview of how well the model performs; however, it is important to acknowledge that it can be misleading when the dataset is imbalanced. In the NBI dataset, 66.26% of bridges are fair, 24.31% are good, and only 9.43% are poor, meaning it is possible to achieve a high accuracy score by only identifying fair bridges correctly, and hence it is not used alone. Precision measures the quality of positive predictions, which is defined by the proportion of correct positive predictions in all positive predictions, shown by the formula below:
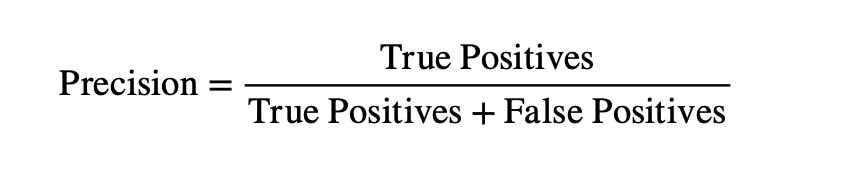
In the condition of budget restrictions, precision would be important, as low recall score would mean predicting good or fair bridges as poor conditioned, causing unnecessary inspections or repairs; therefore, only models with high precision scores are ideal for this task. Recall, on the other hand, shows how complete the positive predictions are, which is how many correctly predicted positives are in all the actual positives, which can be displayed by:
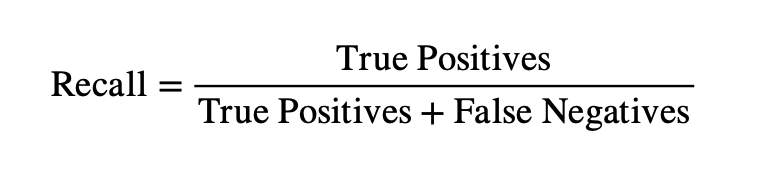
Recall is crucial in this context, as it shows how the model predicts all of the poor bridges correctly. A low recall score would mean that some poor bridges could be predicted as good or fair, leading to potential safety and failure issues. Lastly, the F1-score is a combination of precision and recall, calculated by their harmonic mean. This metric is useful when a balance between precision and recall is wanted. Specifically in the context of bridge condition prediction, missed detection of poor bridges and unnecessary inspections are both unwanted, F1-score would highlight models with imbalances between the two scores, providing a comprehensive evaluation of their performances and usability in real world context. The F1-score is calculated through the formula below:
III. Results
A. Evaluation Metrics
After running all the models on both datasets, illustrations are produced for both datasets. For the MassGIS Data Hub dataset, all of the target fields are in the rating of 1-9 as there is enough data for each category.
Figure 6: Performance Comparison of Machine Learning Models on MassGIS Data Hub Dataset
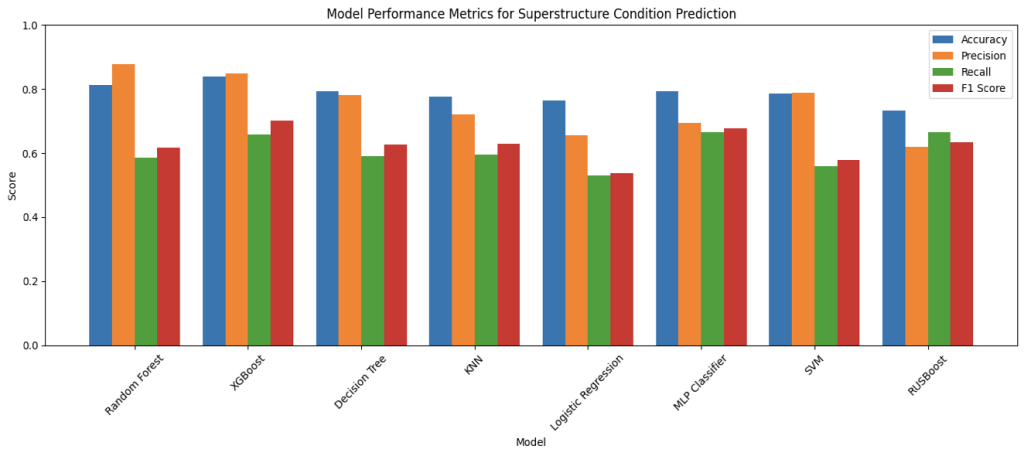
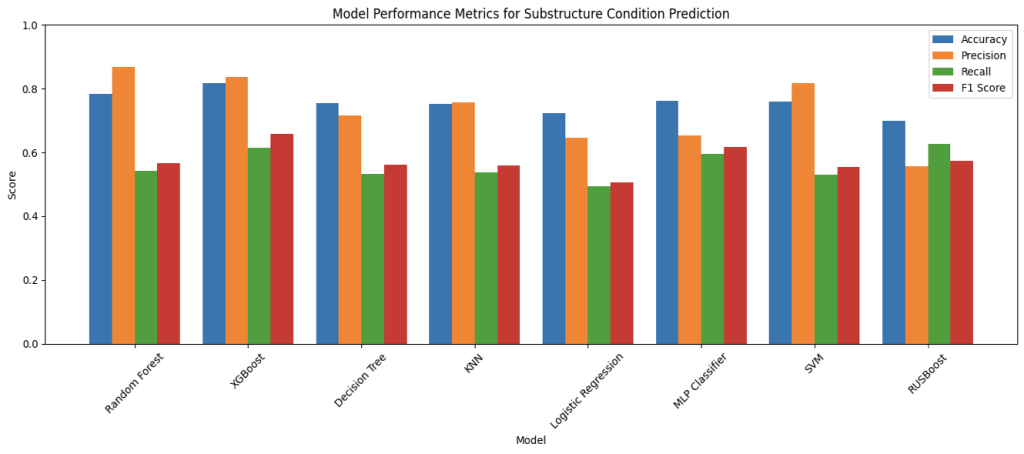
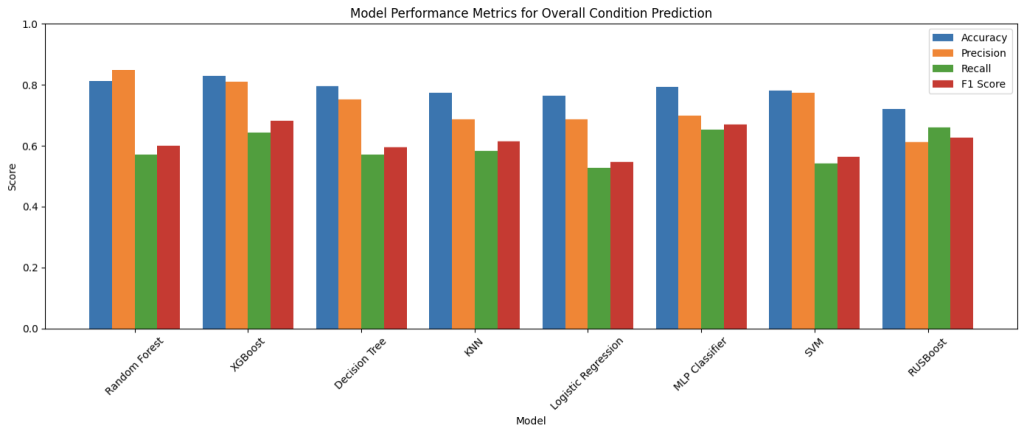
Interpreting the charts above, over the prediction of the bridge decks, superstructures, substructures, and overall condition, Random Forest and XGBoost were the best performing models throughout almost all metrics; specifically, in overall prediction, RF achieved an 81.24% accuracy and XGBoost achieved 82.99% accuracy, and followed by the MLP classifier with 79.29% accuracy. This result follows expectations: firstly, since the target field overallCondition has only three categories (Good, Fair, Poor), it is more likely that the predictions are correct compared to other smaller components; secondly, the two ensemble learning models are inherently good predictors for non-linear interactions between variables and for tabular data, and the neural network MLP classifier is much more complex and stronger than other models tested, making it perform better in condition predictions. However, it is important to acknowledge that accuracy is purely a general measurement of the models’ performance as mentioned earlier, since there are other factors to be considered in the task of bridge condition prediction-specifically recall and precision. It would be more straightforward to analyze the F1-scores as they act as combinations of the two metrics. While Random Forest maintained strong accuracy (81.24%), its F1 score of 59.98% was noticeably lower than those of XGBoost and MLP, indicating a weaker balance of precision and recall, especially in misclassifying minority classes. This therefore illustrates the strong balance precision and recall in XGBoost and MLP, showing how they would be not just accurate, but also reliable and consistent in their predictions. This pattern is especially evident in the prediction of superstructure and substructure where XGBoost achieved F1 scores of 70.27% and 65.70% respectively, and MLP followed with 67.65% and 61.63%, which outperformed other more traditional models in consistency.
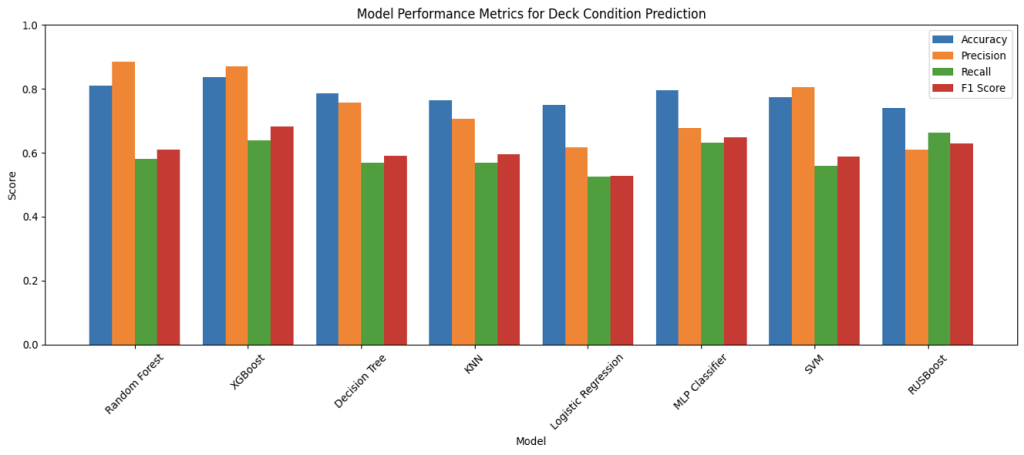
Figure 7: Performance Comparison of Machine Learning Models on NBI Dataset
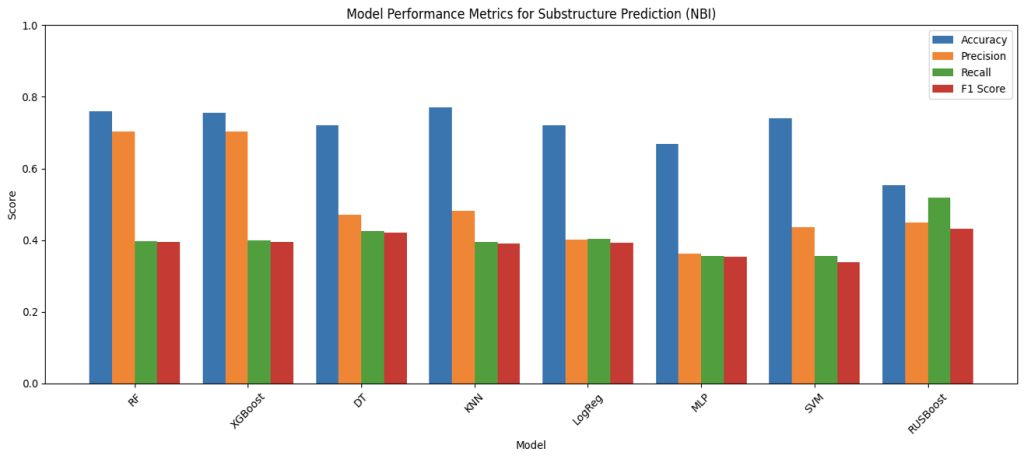
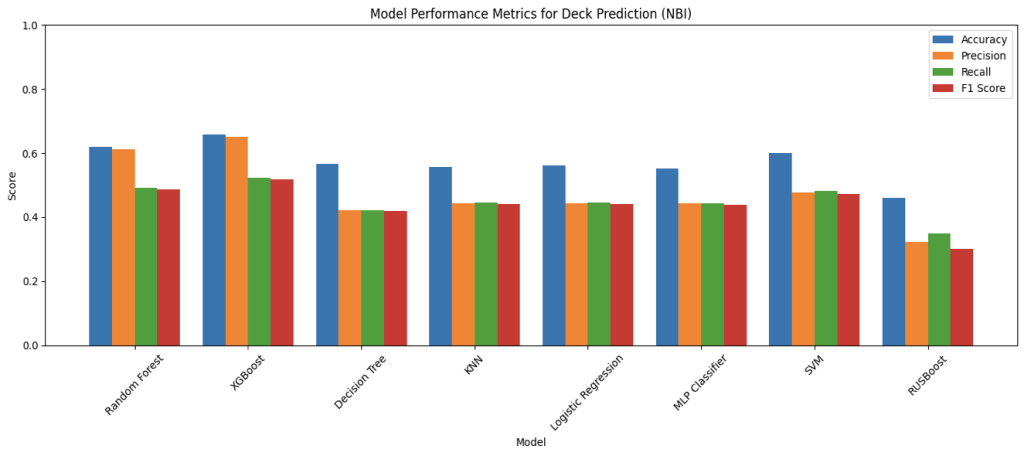
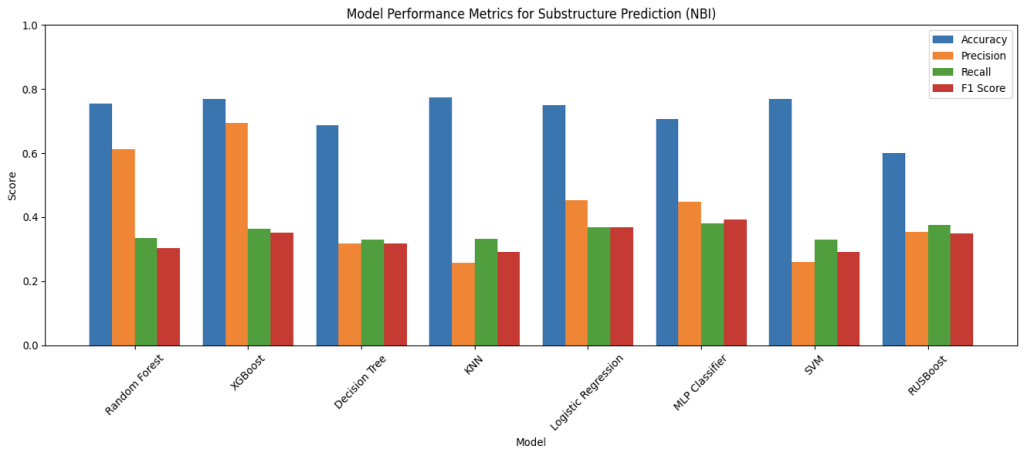
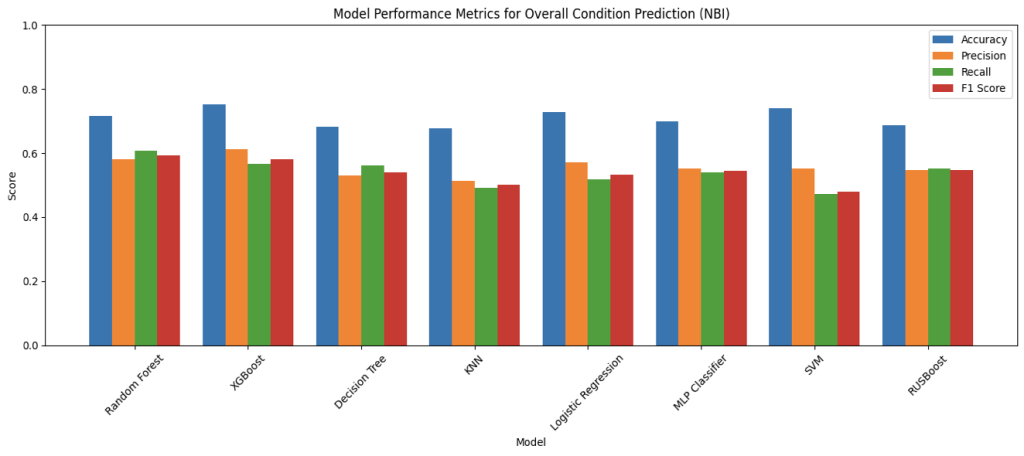
The above four bar charts illustrate the results of the model’s performance on predicting based on the NBI data. For NBI, due to the limited amount of data for each condition rating for every components, the rating of the components are converted into categories of Good, Fair, and Poor with the same ranges as the overall rating. In the metrics for NBI, it can be observed that there is generally a greater gap between accuracy and precision, recall, and F1-score than the scores for MassGIS Data Hub. This is likely caused by the smaller and less balanced data set in the NBI, which after cleaning nulls and rows without data for some predictive fields, there is significantly less data of bridges in the Good category than data in Fair and Poor. And this is possibly a result of having more predictive fields and smaller data size. Looking at the metrics for overall condition predictions, XGBoost achieved the highest score for all metrics except recall, (69.94% for accuracy, 67.66% for precision, and 54.61% for F1-score), which RUSBoost has the highest of 54.23%%. This demonstrates how XGBoost is a strong performer despite the limitation of the dataset, aligning with the previous literature involving XGBoost, and is also consistent with the balance of precision and recall scores, which symbolizes its reliability in potential real world applications. Apart from this, there are also multiple things worth noting about the metrics. In predicting all the components including the overall condition, RUSBoost has maintained a balance score for the four metrics, and an especially high score for recall. This suggests that boosting with undersampling helps the model to handle class imbalances in the NBI, meaning its potential application when balanced and unbiased dataset is unachievable. Furthermore, MLP Classifier, though not the best, shows high consistency throughout the component predictions, with decent F1-score throughout, showing the balance between precision and recall scores, showing MLP Classifier’s potential application to capture the non-linear relationships that’s overlooked by simpler models as a complementary model.
B. Confusion Matrix
To evaluate the specific consistency and accuracy of the top models’ predictions, confusion matrixes are created for XGBoost, Random Forest, and MLP Classifier.
Figure 8: Confusion Matrix of the Three Best Performing Machine Learning Models
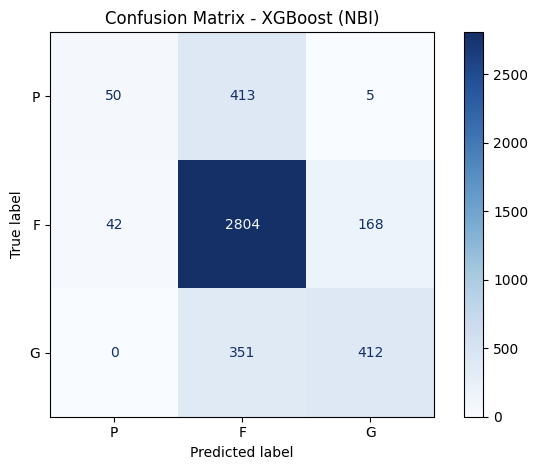
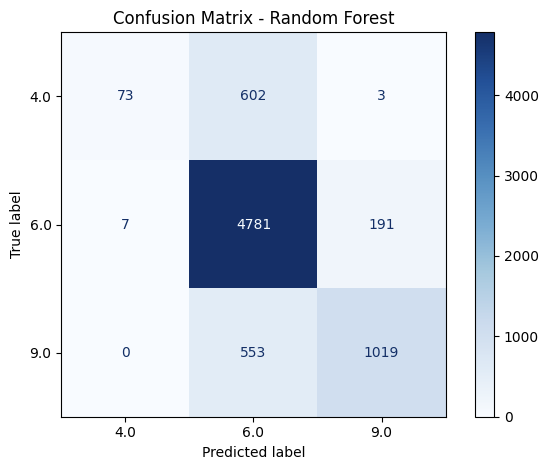
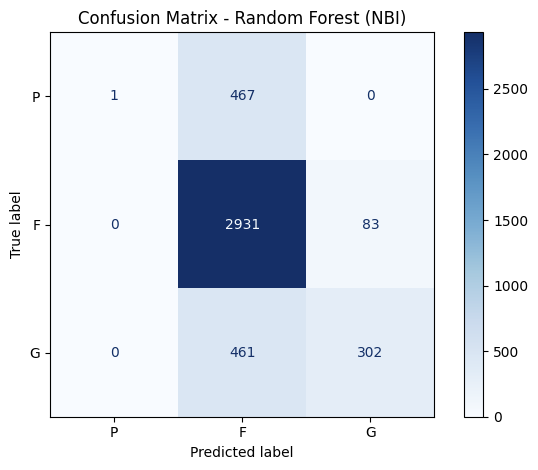
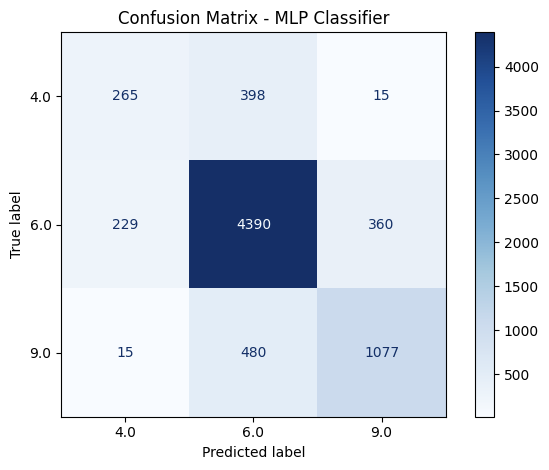
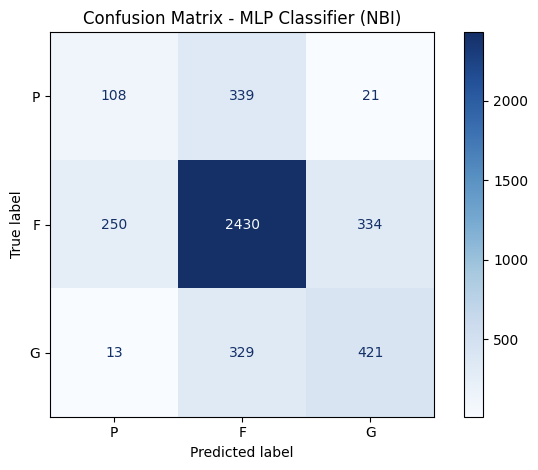
At first glance, the confusion matrix reveals the imbalance of the dataset mentioned earlier, as most of the bridge data included in the two datasets are classified as under the Fair condition. This means that models could achieve a high accuracy score only by predicting the Fair condition correctly. On both datasets, XGBoost correctly classified 180 and 50 poor cases in MassGIS and NBI datasets respectively, indicating the weak sensitivity to structurally deficient bridges, which is likely caused by the comparably small amount of data for Poor conditioned bridges. On the other hand, Random Forest struggled even more severely with 73 and 1 correct classification on the two datasets, suggesting that the previous high accuracy scores were likely caused by the high 4781 and 2931 cases of Fair bridges that it correctly predicted. In contrast, the MLP Classifier demonstrated the strongest accuracies for the Poor condition and most of Good condition, surpassing Random Forest and XGBoost completely. Therefore, considering MLP Classifier’s lowest accuracy for Fair condition, it is the most consistent and balanced model of the three listed. XGBoost and Random Forest, the two models considered as the best performing models’ misclassifcation of Poor condition raises concerns as bridges with poor conditions are also the ones needing intervention and repair the most. Conversely, MLP’s stronger and more balanced prediction of classes with less data provided for training could be a better model for circumstances with smaller data set. Moreover, the overprediction of the Fair condition implies that the current classification’s boundaries are too blurred, reflecting the limitations in the labeled data in Massachusetts. Ultimately, while ensemble models provide a strong accuracy, deep learning models like MLP may offer better balance and reliability in the contest of bridge condition predictions.
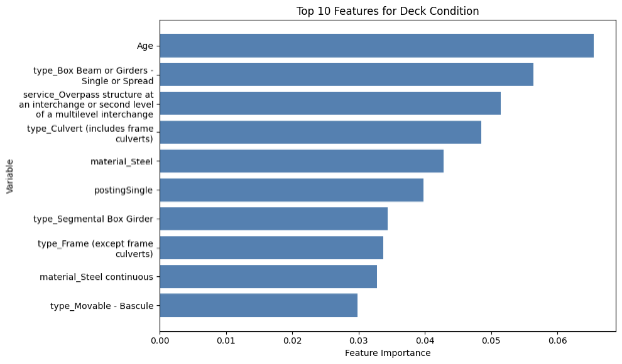
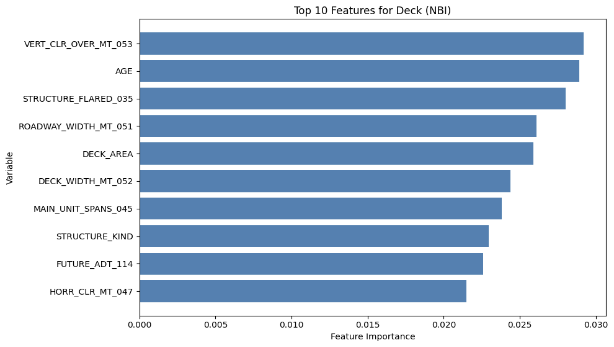
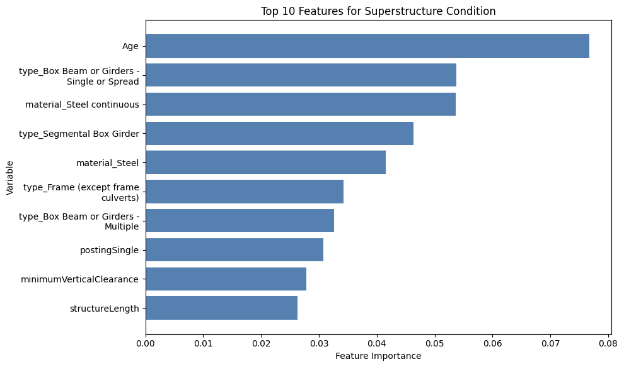
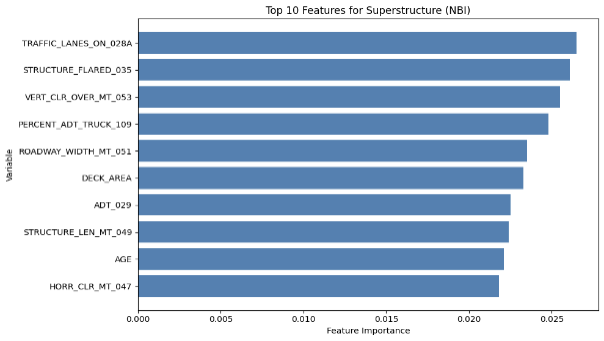
C. Feature Importance
Another feature of the XGBoost is its capability to output the importance of each feature fed into the model for prediction, and the top ten features for each component in each dataset are illustrated by the diagrams below (MassGIS Data Hub on the left and NBI on the right):
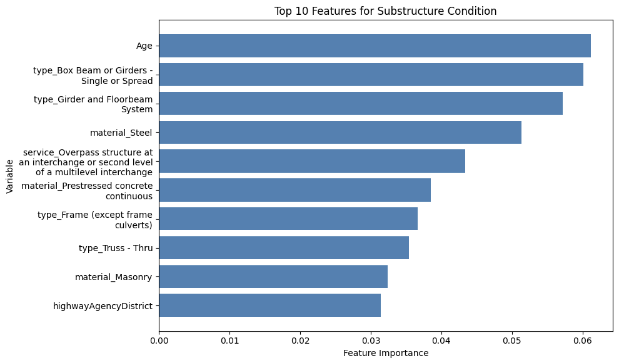
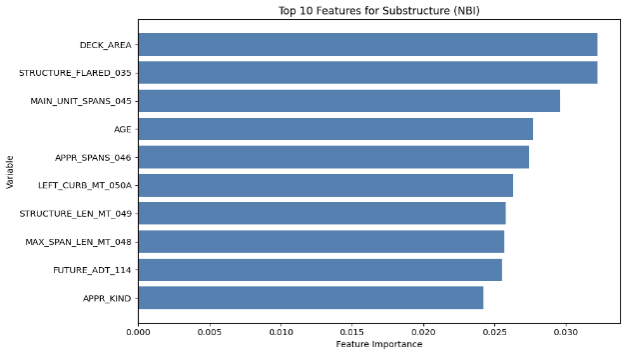
Figure 8: Chart Showing the Importance of Features on Predicting Different Components for XGBoost
Deck Condition
Superstructure Condition
Substructure Condition
Overall Condition
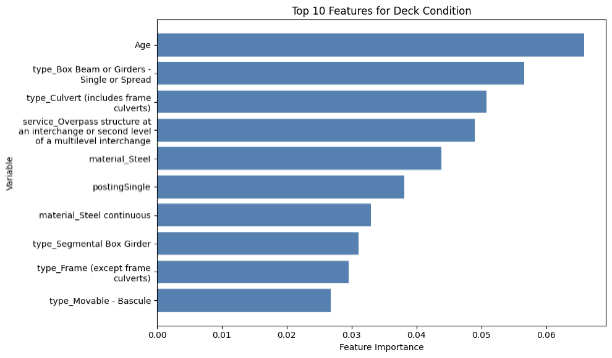
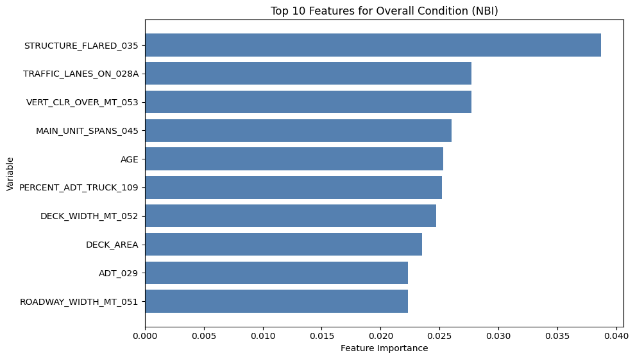
Over the different components, age is one of the most prominent feature in prediction, which is also shown in the results achieved by Mohammadi et al., Nasab et al., and Fard & Fard in their papers. However, the results above also show other important features in prediciton. The top feature in the NBI dataset predictions is STRUCTURE_FLARED_035; a flared bridge would introduce a non-uniform load distribution which could lead to stresses under uneven traffic on top, which could potentially lead to more deterioration than bridges that are not. Also, since flared bridges are also more common in older bridges, it could have an indirect correlation with the poorer conditions of the bridges (Thakkar et al.). Additionally, a major reason could be how flared bridges are generally more difficult to inspect or repair, which could lead to delays in maintenance.
IV. Conclusion
The results from this study make clear how machine learning models such as XGBoost, MLP Classifier, and Random Forest can support more efficient and targeted inspection planning, potentially reducing unnecessary inspections and reallocating resources toward at-risk infrastructure, and decrease the chance of bridge failures caused by lack of maintenance or inspection. Moreover, as the models above also demonstrated high accuracy and balanced precision and recall scores, transportation authorities in Massachusetts, or potentially in the United States, can consider employing such techniques to proactively identify bridges that have higher risk of deterioration and failure. When bridges are predicted in poor condition, the DOT could conduct immediate inspections and maintenance, and when bridges are predicted to be in good condition, the DOT could extend the period between inspections. Overall, this strategy not only improves the efficiency of resource allocation, but also ensures public safety by reducing the failure of overlooked bridges. In addition, the feature importance collected from XGBoost training provides insights into the importance of inspecting bridges in Massachusetts with flared structures and columns, and many other features as listed in the diagram above.
A. Limitations
Starting with the dataset used in this study to train and test machine learning models, the two datasets: MassGIS Data Hub and NBI are both publicly available but are not frequently updated and do not include some images, environmental features, and time-series deterioration patterns in inspections that could boost the accuracy and precision of the models’ predictions, especially for neural network models. A key limitation is as revealed in the confusion matrix, both datasets employed have imbalanced amount of bridge data for each category, in which the number of bridges classified as Fair greatly exceeds the other two categories than the other two. Additionally, due to the use of k-fold cross-validation to avoid the inherent bias of the performance metrics, and because the amount of bridges under each rating from 0-9 is not enough to be distributed to all 5 folds, this study is not able to predict bridge components’ specific ratings from 0-9, which reduces the precision of the outcome and the limits the generalizability of the study to nationwide researches. Furthermore, due to the scope of this study, which only focuses on Massachusetts, the conclusion, even though similar to many previous literature, cannot be directly generalized to other countries, as they would have different traffic patterns, design standards, or management routines. Moreover, the scope of this study also means that climate zone cannot be considered as Massachusetts is within a single climate zone and therefore will not affect the predictions; however, according to other literature, climate zone could potentially provide more information for the models to predict more accurately.
B. Future Work
In future development based on this study, the dataset could be zoomed out to include other states with different bridge management systems to compare the performances of the machine learning models in different environment. Not just the size, since this study only focuses on one climate zone, the environmental factors such as average temperature, wind speed, weather are not considered in the training or testing; therefore, including those factors could provide a more comprehensive conclusion of the feature importance and actual performance of utilizing machine learning models in real scenarios. Moreover, the variety of machine learning methods can be increased, adding methods such as using historical data like Liu & Zhang’s study involving CNN. Lastly, though mentioned in this study, methods such as stacking ensemble or hybrid models are tested; however, they could be much more powerful than using simple and single models like the ones involved in this study.
References
ARTBA Bridge Report. (n.d.). Artbabridgereport.org. https://artbabridgereport.org/
A Comprehensive Assessment of America’s Infrastructure. (2025). American Society of Civil Engineers.
ARTBA 2023 Bridge Report: 222,000 U.S. Bridges Need Major Repairs – ARTBA. (2023, August 13). Https://Www.artba.org/. https://www.artba.org/news/artba-2023-bridge-report-222000-u-s-bridges-need-major-repairs/
Regan, H., Magramo, K., Radford, A., Ebrahimji, A., Chowdhury, M., Ramirez, R., Hammond, E., Aditi Sangal, Powell, T. B., Blackburn, P. H., & Magramo, K. (2024, March 26). March 26, 2024 – Baltimore Key Bridge collapses after ship collision. CNN. https://www.cnn.com/us/live-news/baltimore-bridge-collapse-03-26-24-intl-hnk
Infrastructure Investment and Jobs Act | FHWA. (2022). Dot.gov. https://highways.dot.gov/tags/infrastructure-investment-and-jobs-act
Assaad, R., & El-adaway, I. H. (2020). Bridge Infrastructure Asset Management System: Comparative Computational Machine Learning Approach for Evaluating and Predicting Deck Deterioration Conditions. Journal of Infrastructure Systems, 26(3), 04020032. https://doi.org/10.1061/(asce)is.1943-555x.0000572
Chen, R.-C., Dewi, C., Huang, S.-W., & Caraka, R. E. (2020). Selecting critical features for data classification based on machine learning methods. Journal of Big Data, 7(1). https://doi.org/10.1186/s40537-020-00327-4
Liu, H., & Zhang, Y. (2020). Bridge condition rating data modeling using deep learning algorithm. Structure and Infrastructure Engineering, 16(10), 1447–1460. https://doi.org/10.1080/15732479.2020.1712610
Md. Manik Mia, & Sabarethinam Kameshwar. (2023). Machine learning approach for predicting bridge components’ condition ratings. Frontiers in Built Environment, 9. https://doi.org/10.3389/fbuil.2023.1254269
Mohammadi, P., Asgari, S., Rashidi, A., & Alder, R. (2025). Culvert Inspection Framework Using Hybrid XGBoost and Risk-Based Prioritization: Utah Case Study. Journal of Construction Engineering and Management, 151(6). https://doi.org/10.1061/jcemd4.coeng-16448
Armin Rashidi Nasab, & Hazem Elzarka. (2023). Optimizing Machine Learning Algorithms for Improving Prediction of Bridge Deck Deterioration: A Case Study of Ohio Bridges. Buildings, 13(6), 1517–1517. https://doi.org/10.3390/buildings13061517
Fard, F., & Sadeghi, F. (2024). Development and Utilization of Bridge Data of the United States for Predicting Deck Condition Rating Using Random Forest, XGBoost, and Artificial Neural Network. Remote Sensing, 16(2), 367–367. https://doi.org/10.3390/rs16020367
Li, Q., & Song, Z. (2022). Ensemble-Learning-Based Prediction of Steel Bridge Deck Defect Condition. Applied Sciences, 12(11), 5442. https://doi.org/10.3390/app12115442
Thakkar, K., Rana, A., & Goyal, H. (2023). Fragility analysis of bridge structures: a global perspective & critical review of past & present trends. Advances in Bridge Engineering, 4(1). https://doi.org/10.1186/s43251-023-00089-y
Jeon, J.-S., Sujith Mangalathu, & Lee, S.-Y. (2019). Seismic fragility curves for California concrete bridges with flared two-column bents. Bulletin of Earthquake Engineering, 17(7), 4299–4319. https://doi.org/10.1007/s10518-019-00621-4
About the author
Yu Tung Hua
Yu Tung has had a strong interest in the field of engineering and programming since a very young age, starting with robotics. During the last 5 years, while competing in multiple Robotics Competitions, he continued to study programming and application in the field of robotics. Yu Tung has studied Machine Learning and Data Science at Columbia University’s summer program and worked with his mentor Dr. Asgari to apply his knowledge on Machine Learning to the real world context of bridge inspection.