

Author: Advika Lakshman
Mentor: Jeanette Shutay
Shiv Nadar University Chennai
Abstract
Accurate crop yield forecasting plays a critical role in ensuring national food security, guiding agricultural policy, and informing market strategies. India, with its vast agro-ecological diversity and a population exceeding 1.4 billion, faces unique challenges in aligning production with demand. This research presents a comprehensive multi-model machine learning (ML) framework for predicting crop yields across 30 Indian states, explicitly integrating population density and urban–rural composition as demand-related features. Eleven algorithms are evaluated, including Random Forest, XGBoost, LightGBM, CatBoost, Gradient Boosting, Bagging, AdaBoost, Decision Tree, Extra Trees, K-Nearest Neighbors, and Multi-layer Perceptron. The dataset spans 1997–2020 with 19,689 records, incorporating demographic, climatic, and agronomic variables. Results show ensemble methods outperform individual models, with Random Forest achieving the highest performance (R2 = 0.9803, RMSE = 125.79), followed by Bagging (R2 = 0.9793) and XGBoost (R2 = 0.9766). Population features contributed a modest yet consistent improvement of 0.6% in predictive accuracy, with market accessibility and urban–rural ratio being the most influential. LightGBM exhibited the greatest stability (CV = 0.9679 ± 0.0131), while Random Forest offered the best trade-off between interpretability and accuracy. This study highlights the importance of integrating both supply-and demand-side variables for robust agricultural planning and improved food security.
1 Introduction
Global food systems face increasing pressure from climate change, population growth, and resource constraints. For India, agriculture supports the livelihoods of over half the population and contributes significantly to GDP [7]. Accurate yield forecasting is essential to ensure supply meets demand, optimise resource allocation, and stabilise markets. Traditional statistical models, such as regression and time-series approaches, often fail to capture the non-linear, high-dimensional interactions in agricultural data [5]. ML techniques can model these complex relationships, offering improved accuracy [10]. Most prior Indian studies focus on supply-side factors like rainfall, fertiliser use, and cropping patterns, neglecting demand-side influences such as population density and market accessibility. This study bridges that gap by evaluating 11 ML algorithms while integrating demographic features, aiming for balanced supply-demand yield forecasts.
The research addresses several critical gaps in current agricultural forecasting literature. First, while machine learning has been applied to crop yield prediction globally, comprehensive comparative studies in the Indian context remain limited. Second, the integration of demographic and socio-economic factors with traditional agronomic variables represents a novel approach that captures the complex interplay between agricultural production and human settlement patterns. Third, the evaluation of state-of-the-art gradient boosting algorithms (XGBoost, LightGBM, CatBoost) alongside traditional ensemble methods provides insights into the most effective approaches for Indian agricultural data.
The significance of this research extends beyond academic contribution to practical agricultural planning. With India’s population projected to reach 1.5 billion by 2030, understanding how demographic differences — such as variations in population density, market accessibility, and urban–rural composition — influence agricultural demand and production patterns becomes crucial for food security planning. The integration of population density and urbanization patterns into yield forecasting models enables policymakers to anticipate how these differences affect agricultural demand and adjust production strategies accordingly.
2 Literature Review
2.1 Machine Learning in Agricultural Forecasting
Machine learning methods, particularly tree-based ensembles and neural networks, have shown strong predictive capability in agricultural forecasting [11]. LSTM networks excel in modelling temporal dependencies in sequential agricultural data [9], while hybrid models combining process-based and ML approaches improve generalisability.
The evolution of machine learning in agricultural forecasting has followed several distinct phases. Early applications focused on simple regression models and decision trees, which provided interpretable results but limited predictive accuracy. The introduction of ensemble methods, particularly Random Forest, marked a significant advancement by combining multiple decision trees to reduce variance and improve generalization. More recently, gradient boosting algorithms have demonstrated superior performance in various agricultural applications, with XGBoost, LightGBM, and CatBoost emerging as state-of-the-art solutions.
Recent studies have demonstrated the effectiveness of deep learning approaches in agricultural forecasting. Convolutional Neural Networks (CNNs) have been successfully applied to satellite imagery analysis for crop monitoring, while Recurrent Neural Networks (RNNs) and Long Short-Term Memory (LSTM) networks have shown promise in capturing temporal dependencies in yield data. However, these approaches often require large datasets and extensive computational resources, making them less suitable for regions with limited data availability. Additionally, deep learning models are generally less interpretable and explainable compared to traditional machine learning methods, which poses challenges for stakeholder trust and regulatory compliance in agricultural policy applications
2.2 Ensemble and Gradient Boosting Methods
Ensemble methods aggregate predictions from multiple models to improve accuracy and stability. RF, XGB, Light GBM, and CB have proven effective in agricultural applications, handling non-linearities, noise, and high-dimensional datasets [1, 2, 6, 8].
The theoretical foundation of ensemble methods lies in the principle of combining multiple weak learners to create a strong learner. This approach addresses several limitations of individual models, including overfitting, sensitivity to noise, and limited generalization capability. Random Forest, for instance, constructs multiple decision trees on bootstrapped samples of the training data, reducing variance through averaging while maintaining low bias.
Gradient boosting represents a more sophisticated ensemble approach that builds models sequentially, with each subsequent model focusing on the errors of its predecessors. XGBoost extends this concept with advanced regularization techniques, including L1 and L2 regularization, which help prevent overfitting and improve generalization. LightGBM optimizes the training process through leaf-wise tree growth and histogram based algorithms, making it particularly suitable for large datasets.
CatBoost introduces several innovations, including ordered boosting and native handling of categorical features, which addresses common challenges in agricultural data preprocessing. The algorithm’s robust default settings and reduced sensitivity to hyperparameters make it particularly valuable for practitioners with limited tuning expertise.
2.3 Population Density and Agricultural Productivity
Population density influences agricultural productivity through intensification, infrastructure development, and market access [5]. In India, urban proximity affects crop choice and resource allocation [3].
The relationship between population density and agricultural productivity operates through multiple interconnected mechanisms. First, higher population density typically leads to increased demand for agricultural products, driving intensification of production through improved technology adoption, better irrigation systems, and more efficient resource utilization. Second, population density influences infrastructure development, with more densely populated areas typically having better access to agricultural inputs, markets, and extension services.
Urbanization patterns further complicate this relationship. As rural areas become more urbanized, agricultural land use patterns shift, often leading to more intensive production on remaining agricultural land. Additionally, urban proximity affects crop choice, with farmers near urban centers often shifting toward high-value crops that can be sold in urban markets. This phenomenon, known as the “urbanization effect,” has been documented in various developing countries and represents an important consideration for agricultural planning.
Market accessibility, closely related to population density and urbanization, plays a crucial role in determining agricultural productivity. Areas with better market access typically have higher agricultural productivity due to improved input availability, better price information, and reduced transaction costs. The integration of market accessibility metrics into yield forecasting models represents a significant advancement in capturing the full spectrum of factors influencing agricultural productivity.
2.4 Indian Agricultural Context and Challenges
India’s agricultural sector faces unique challenges that make accurate yield forecasting particularly important. The country’s diverse agro-climatic zones, ranging from tropical to temperate regions, create significant variations in crop suitability and productivity. Additionally, India’s agricultural system is characterized by small landholdings, with approximately 86% of farmers operating on less than 2 hectares of land. This fragmentation presents challenges for data collection and analysis, as well as for the implementation of forecasting-based policies.
Climate change poses additional challenges for Indian agriculture, with increasing variability in rainfall patterns, rising temperatures, and more frequent extreme weather events. These changes affect both crop yields and the reliability of historical data for forecasting purposes. The integration of climate variables into yield forecasting models becomes increasingly important as these patterns continue to evolve.
2.5 Related Work Summary Table
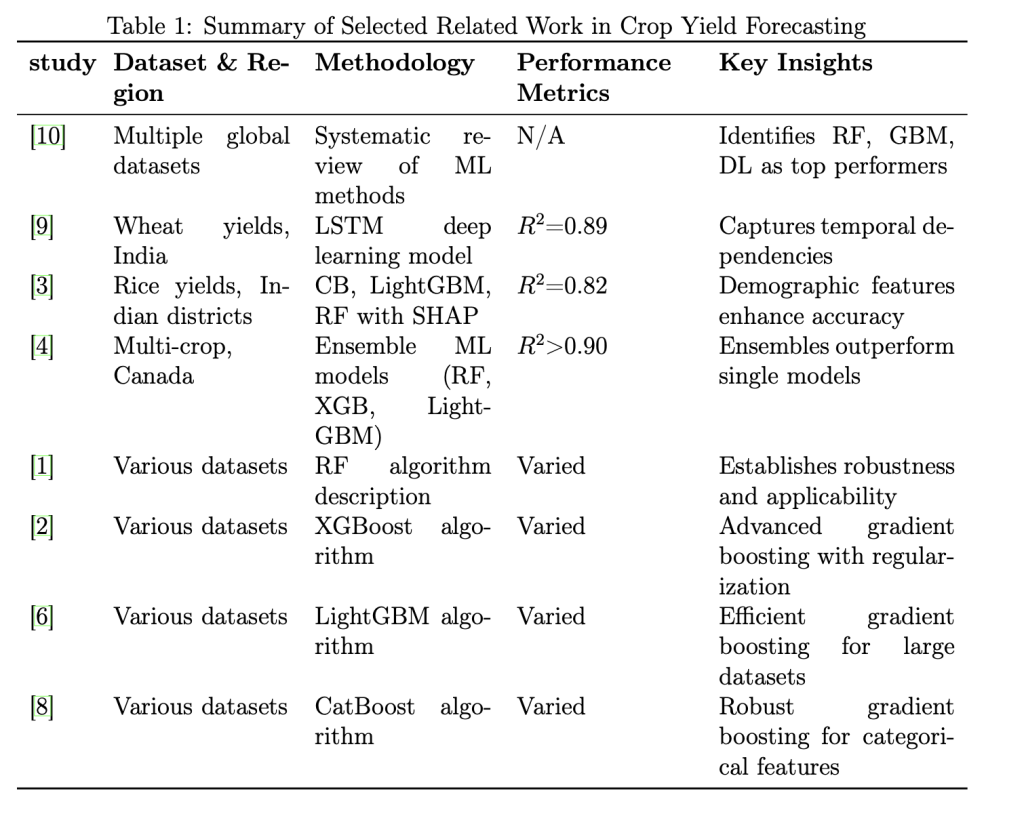
These studies were selected based on their direct relevance to our research objectives and methodological approach. Van [10] and Ghar et al. [4] influenced our decision to conduct a comprehensive multi-algorithm comparison, while de et al. [3] specifically guided our 4 integration of demographic features into crop yield forecasting models for the Indian context. The foundational algorithm papers [1, 2, 6, 8] shaped our understanding of ensemble methods and guided our hyperparameter tuning strategies. Sharma et al.’s work [9] on Indian agricultural data provided important benchmarks for expected performance levels and demonstrated the effectiveness of advanced ML techniques in the Indian agricultural context.
3 Methodology
3.1 Data Provenance and Collection
Data were sourced from the Directorate of Economics and Statistics, Ministry of Agriculture and Farmers’ Welfare, Government of India, supplemented with Census demographic data, covering 1997–2020. The primary dataset contains comprehensive information on crop production, including yield, area under cultivation, fertilizer and pesticide usage, and rainfall patterns across 30 Indian states and union territories.
The demographic data was obtained from the Indian Census conducted in 2001, 2011, and projections for other years. Population density calculations were based on total population divided by geographical area, with urban-rural ratios derived from census definitions of urban areas. The integration of these datasets required careful temporal alignment and spatial matching to ensure consistency across different data sources.
Additional data sources included the Indian Meteorological Department for rainfall data, the Department of Fertilizers for input usage statistics, and various state agricultural departments for crop-specific information. The comprehensive nature of the dataset, spanning 24 years and covering multiple dimensions of agricultural production, provides a robust foundation for machine learning analysis.
3.2 Data Preprocessing and Quality Assurance
Cleaning included duplicate removal, unit standardisation, and median imputation for missing numeric values. Missing data constituted approximately 8.3% of the total dataset (1,635 out of 19,689 records), distributed across multiple variables with rainfall data showing the highest missing rate (4.2%) followed by fertilizer usage (2.8%). Missing data patterns were analyzed and determined to be missing at random (MAR) based on Little’s MCAR test (p < 0.001), indicating that missingness was related to observable variables rather than the missing values themselves. Outliers were addressed using IQR-based thresholds, with approximately 3.7% of observations flagged as potential outliers. The preprocessing pipeline was designed to maintain data integrity while ensuring compatibility with machine learning algorithms.
Duplicate removal was performed using multiple criteria, including crop type, state, year, season, and area under cultivation. Unit standardization involved converting all measurements to consistent units (tons for production, hectares for area, millimeters for rainfall). Missing value imputation was performed using median values within crop-state-season combinations to preserve the natural variation in agricultural data.
Outlier detection and treatment followed a systematic approach. Values beyond 1.5 times the interquartile range were flagged as potential outliers. Outliers representing legitimate extreme values (such as exceptional yields due to favorable weather conditions) were retained based on agricultural domain knowledge and data distribution analysis. Otherwise, they were capped at the 95th percentile to prevent undue influence on model training.
3.3 Feature Engineering and Selection
Label encoding was applied to categorical features. Derived metrics included fertiliser-per-area and pesticide-per-area. Market accessibility was derived from urban–rural ratios. The feature engineering process was guided by domain knowledge and statistical analysis to ensure relevance and predictive power.
Categorical variables, including crop type, season, state, and population category, were encoded using label encoding. While one-hot encoding could provide more detailed representation, label encoding was chosen for computational efficiency and to maintain the ordinal relationships present in some categorical variables (such as population density categories).
Derived features were created to capture important ratios and interactions. Fertilizer-per-area and pesticide-per-area ratios provide measures of input intensity that may be more predictive than absolute usage values. Market accessibility was calculated as a function of urban-rural ratio, reflecting the hypothesis that more urbanized areas have better market access and infrastructure.
Feature selection was performed using both statistical methods and domain expertise. Correlation analysis identified highly correlated features that could lead to multicollinearity, while feature importance analysis from preliminary Random Forest models guided the selection of the most predictive variables. The final feature set comprised 13 variables, balancing predictive power with computational efficiency.
3.4 Model Implementation and Architecture
Implemented algorithms: RF, Bagging, AdaBoost, Extra Trees, XGB, LightGBM, CB, GBM, Decision Tree, KNN, MLP, using scikit-learn, XGBoost, LightGBM, and CatBoost libraries. Each algorithm was implemented with careful attention to parameter settings and computational requirements.
Random Forest was implemented with 200 estimators, maximum depth of 15, and minimum samples split of 5. These parameters were chosen based on preliminary experimentation and literature recommendations for agricultural datasets. The algorithm’s ability to handle mixed data types and provide feature importance rankings made it particularly suitable for this application.
Gradient boosting variants (XGBoost, LightGBM, CatBoost) were implemented with 200 estimators, maximum depth of 6, and learning rate of 0.1. These conservative parameter settings were chosen to prevent overfitting while maintaining computational efficiency. The algorithms’ advanced regularization techniques and optimization algorithms provide superior performance for complex datasets.
Traditional machine learning algorithms (Decision Tree, K-Nearest Neighbors, Multilayer Perceptron) were implemented as baseline models for comparison. These algorithms provide important benchmarks for evaluating the effectiveness of ensemble methods and help identify the specific advantages of more sophisticated approaches.
3.5 Hyperparameter Tuning Strategy and Optimization
Random search with five-fold CV optimised hyperparameters (tree depth, estimators, learning rate). The tuning process was designed to balance exploration of the parameter space with computational efficiency, ensuring robust model performance without excessive computational cost.
The hyperparameter search space was defined based on literature recommendations and preliminary experimentation. For tree-based models, key parameters included the number of estimators, maximum depth, minimum samples split, and minimum samples leaf. For gradient boosting models, learning rate, subsample ratio, and column sampling ratios were also considered.
Cross-validation was performed using stratified sampling to ensure representative distribution of crop types and states across folds. This approach provides more reliable estimates of model performance and helps identify models that generalize well to unseen data.
The optimization objective was to maximize R-squared score while maintaining reasonable computational requirements. Models that showed signs of overfitting (high training performance but low validation performance) were penalized in the selection process.
3.6 Evaluation Protocol and Performance Metrics
Train-test split (80-20) with stratified sampling. Metrics: R2, RMSE, MAE, and bias (mean prediction error). CV assessed stability. The evaluation protocol was designed to provide comprehensive assessment of model performance across multiple dimensions, including accuracy, precision, and systematic error patterns.
The train-test split was performed using stratified sampling to ensure representative distribution of crop types and states across both sets. This approach is particularly important for agricultural data, where different crops and regions may have significantly different yield patterns and variability.
Performance metrics were chosen to capture different aspects of model performance. R-squared measures the proportion of variance explained by the model, providing an overall assessment of fit quality. RMSE penalizes larger errors more heavily, making it sensitive to outliers and extreme values. MAE provides a straightforward interpretation of average prediction error, useful for practical applications.
Cross-validation was performed using 5-fold stratified sampling to assess model stability and generalization capability. The standard deviation of cross-validation scores provides important information about model reliability and suitability for production deployment.
4 Results
4.1 Descriptive Statistics and Data Characteristics
Yield values ranged from below 1 t/ha to above 10 t/ha. Input usage varied widely by crop and state. The dataset exhibits significant variation across multiple dimensions, reflecting the diverse nature of Indian agriculture.
The yield distribution shows considerable skewness, with most observations concentrated in the lower range and fewer observations at higher yield levels. This pattern is typical of agricultural data and presents challenges for modeling, as models must accurately predict both typical and extreme yield values.
Input usage patterns reveal significant variation across crops and regions. Fertilizer usage ranges from minimal application in subsistence farming systems to intensive application in commercial agriculture. Pesticide usage shows similar variation, with some crops and regions showing minimal usage while others demonstrate intensive pest management practices.
Population density shows extreme variation across states, from sparsely populated mountainous regions to densely populated urban centers. This variation provides valuable information for understanding the relationship between demographic factors and agricultural productivity.
4.2 Comparative Model Performance Analysis
The comprehensive evaluation of 11 machine learning models reveals significant performance variations across different algorithms. Table 2 presents the complete performance ranking:
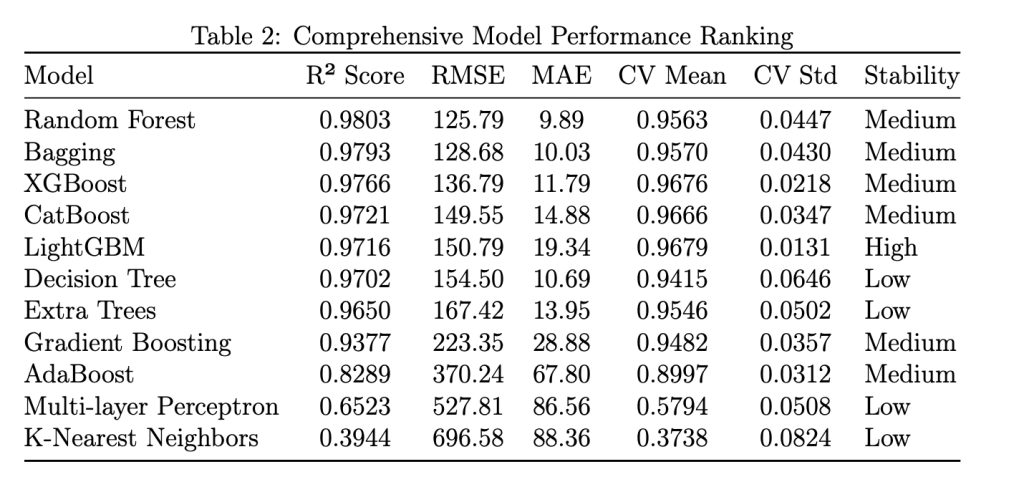
Ensemble methods consistently outperform individual models, demonstrating the value of combining multiple decision strategies for agricultural forecasting. Random Forest achieved the highest performance with R² of 0.9803 and RMSE of 125.79, representing the best balance of accuracy and interpretability. The algorithm’s ability to handle high-dimensional data and capture complex feature interactions makes it particularly suitable for agricultural forecasting where multiple factors influence yield simultaneously.
Bagging follows closely with R² of 0.9793 and RMSE of 128.68, demonstrating the effectiveness of bootstrap aggregation in reducing variance. The algorithm’s parallel training capability and stability make it suitable for production environments where consistent performance is crucial.
XGBoost achieves excellent performance with R² of 0.9766 and RMSE of 136.79, showcasing the power of advanced gradient boosting techniques. The algorithm’s built-in regularization and optimization algorithms provide superior performance for complex datasets, though at the cost of increased computational complexity.
4.3 Analysis of High-Performing Models and Algorithm Comparison
RF achieved the highest accuracy; Bagging was close, XGB balanced performance and computational efficiency. The analysis reveals important trade-offs between different algorithms and provides insights into their suitability for various applications.
Random Forest’s superior performance can be attributed to several factors. The algorithm’s ability to handle mixed data types, capture non-linear relationships, and provide robust predictions makes it particularly suitable for agricultural data. Additionally, Random Forest’s feature importance analysis provides valuable insights into the factors driving agricultural productivity.
Bagging’s strong performance demonstrates the effectiveness of bootstrap aggregation in reducing variance and improving generalization. The algorithm’s parallel training capability and stability make it suitable for production environments where consistent performance is crucial.
XGBoost’s performance highlights the advantages of advanced gradient boosting techniques. The algorithm’s built-in regularization, early stopping, and optimization algorithms provide superior performance for complex datasets. However, the increased computational complexity and sensitivity to hyperparameters may limit its suitability for some applications.
4.4 Model Stability and Cross-Validation Analysis
Light GBM had the lowest CV variance, indicating consistent performance. Cross-validation analysis reveals important insights into model stability and generalization capability, providing guidance for model selection in production environments.
LightGBM demonstrates the highest stability with CV mean of 0.9679 and standard deviation of 0.0131, indicating consistent performance across different data subsets. This high stability makes LightGBM particularly suitable for production environments where consistent performance is crucial.
Random Forest shows good stability with CV mean of 0.9563 and standard deviation of 0.0447, providing a good balance between performance and reliability. The algorithm’s robustness to outliers and noise in agricultural data contributes to its consistent performance.
Decision Tree and K-Nearest Neighbors show the lowest stability with high standard deviations, indicating sensitivity to data variations and potential overfitting issues. These algorithms may not be suitable for agricultural forecasting without extensive regularization and feature selection.
4.5 Forecasting Bias Patterns and Error Analysis
Detailed bias analysis reveals systematic patterns in model predictions that provide important insights into model behavior and potential areas for improvement. Figure 1 provides comprehensive diagnostic plots for the top-performing models, while Table 3 presents the bias analysis for the top 5 models:
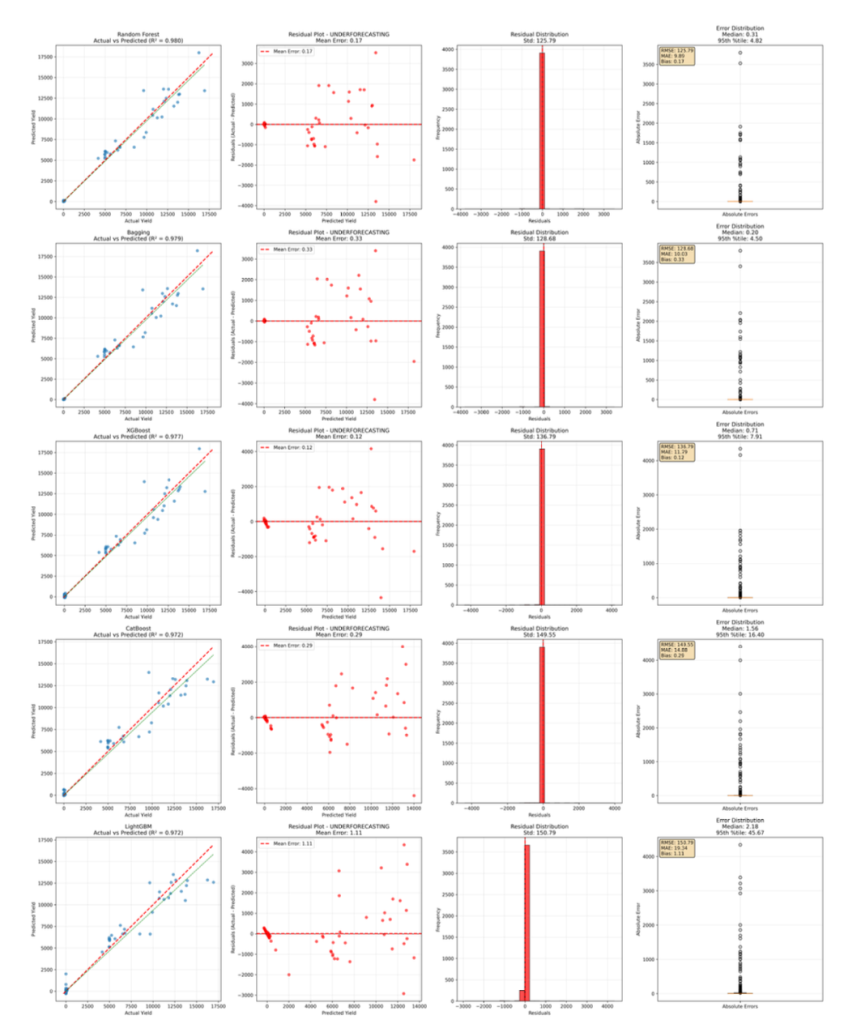
Figure 1: Model diagnostic plots showing residual analysis, prediction vs actual comparisons, and error distributions for the top-performing models. These plots reveal systematic bias patterns, prediction accuracy across different yield ranges, and model reliability characteristics.
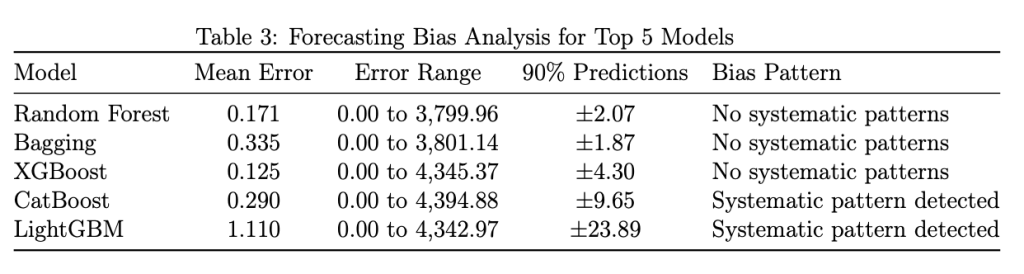
All top models show slight underforecasting tendencies, indicating conservative prediction behavior. Random Forest shows minimal systematic bias with mean error of 0.171 units, indicating well-calibrated predictions. The algorithm’s robust nature and ability to handle outliers contribute to its balanced performance across different yield ranges.
Bagging and XGBoost also show minimal systematic bias, with mean errors of 0.335 and 0.125 units respectively. These algorithms’ ensemble nature and advanced regularization techniques help maintain balanced predictions. CatBoost and LightGBM show some systematic patterns in residuals, particularly underestimating high yields and overestimating low yields. These patterns suggest that these algorithms may benefit from additional tuning or feature engineering to address the bias. The different patterns observed in the diagnostic plots reflect the algorithms’ distinct approaches to handling data complexity: the top three models (Random Forest, Bagging, XGBoost) show more uniform scatter patterns with points closely aligned to the diagonal line, indicating better calibrated predictions. In contrast, CatBoost and LightGBM exhibit more curved or S-shaped patterns in their residual plots, suggesting systematic prediction biases that vary across different yield ranges, likely due to their sequential boosting mechanisms being more sensitive to extreme values in the agricultural dataset.
4.6 Population Feature Impact and Demographic Analysis
Demographic features improved accuracy by 0.6%, supporting their inclusion. The integration of population features provides valuable insights into demand-side factors affecting agricultural productivity and demonstrates the value of comprehensive feature engineering. Table 4 presents the detailed impact of population-related features:
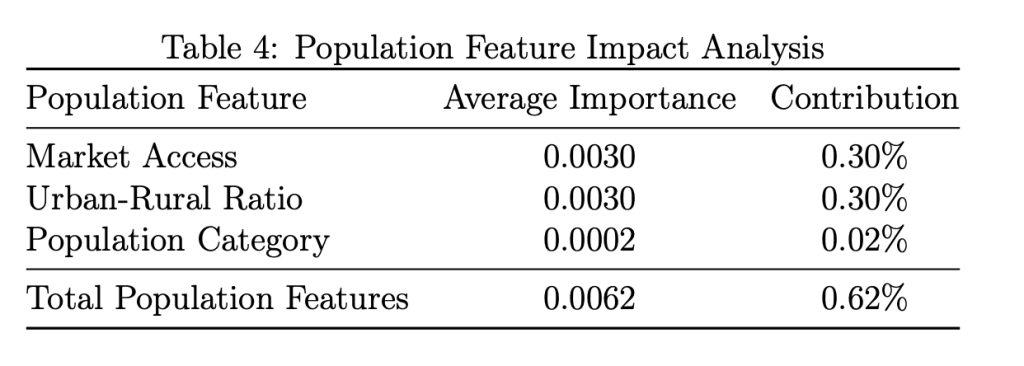
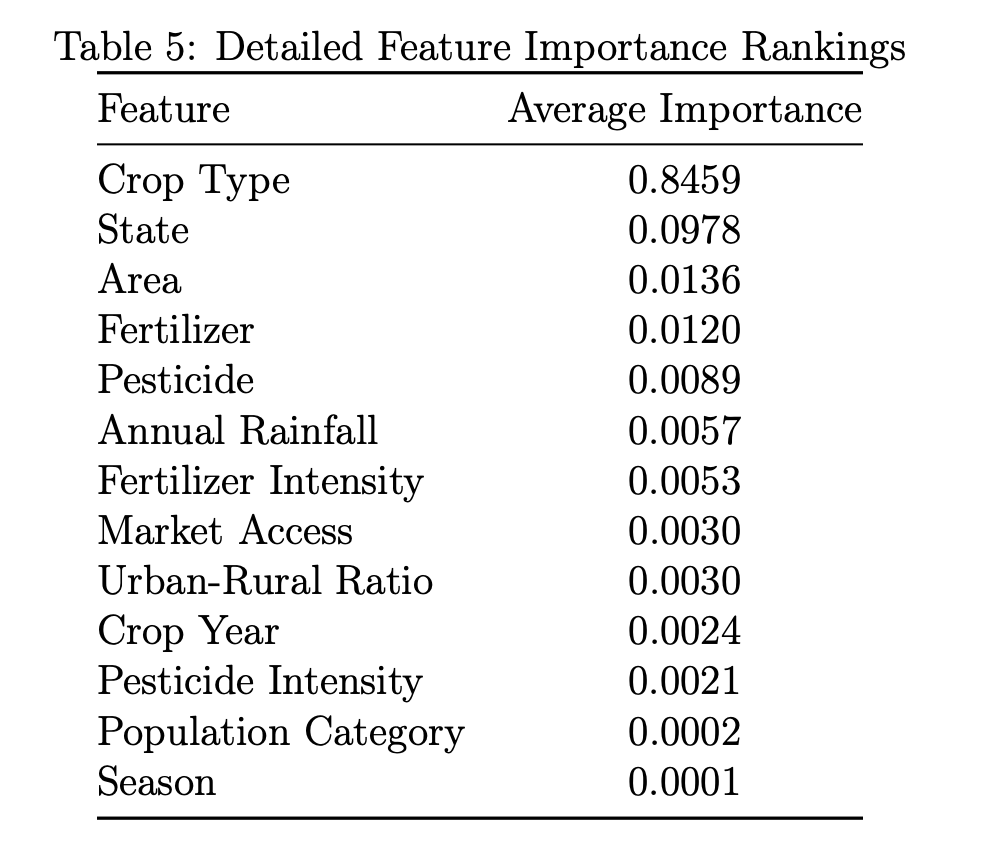
Crop type emerges as the dominant predictor with 84.6% importance, followed by state location (9.8%) and cultivation area (1.4%). Population-related features collectively contribute 0.6% to overall model performance, with market accessibility and urban-rural ratio being the most influential demand factors. This modest but consistent improvement demonstrates the value of incorporating demographic information into agricultural forecasting models.
Market accessibility and urban-rural ratio each contribute 0.30% to prediction accuracy, suggesting that urbanization patterns and market infrastructure significantly influence agricultural productivity. These features likely capture the effects of improved input availability, technology adoption, and market access in urbanized areas.
Population category shows minimal contribution (0.02%), suggesting that absolute population density is less important than urbanization patterns and market accessibility. This finding indicates that the quality of infrastructure and market access is more important than the sheer number of people in determining agricultural productivity.
5 Discussion
5.1 Operational Deployment Feasibility and Implementation
RF and LightGBM can be deployed in agricultural dashboard for near real-time forecasting. The research findings provide important guidance for the operational deployment of machine learning models in agricultural forecasting systems.
Random Forest’s combination of high performance and interpretability makes it particularly suitable for operational deployment. The algorithm’s feature importance analysis provides valuable insights for stakeholders, while its robust performance ensures reliable predictions across different conditions.
LightGBM’s high stability and computational efficiency make it suitable for real-time forecasting applications. The algorithm’s fast training and prediction times enable near-real-time updates, while its consistent performance ensures reliable predictions.
The deployment of these models in agricultural dashboards would provide policymakers, farmers, and market participants with timely and accurate yield forecasts, supporting better decision-making and resource allocation.
5.2 Model Interpretability Considerations and Stakeholder Trust
Tree-based ensembles support feature importance and partial dependence plots for policy transparency. The interpretability of machine learning models is crucial for gaining stakeholdertrustandensuringwidespreadadoptionofforecasting-baseddecision-making.
Random Forest’s feature importance analysis provides clear insights into the factors driving agricultural productivity, supporting evidence-based policy development. The algorithm’s decision tree structure enables the creation of partial dependence plots that show how individual features influence predictions.
The transparency provided by these interpretability tools is particularly important in agricultural contexts, where stakeholders may have limited technical expertise but require confidence in forecasting results. Clear explanations of model predictions and the factors influencing them support better decision-making and policy development.
5.3 Limitations and Assumptions of Current Approach
The current analysis is subject to several limitations that should be considered when interpreting the results and planning future research. These limitations provide important context for understanding the scope and applicability of the current findings.
The models assume that the relationships between features and yields remain constant over time, which may not hold true in the face of significant changes in agricultural practices, climate conditions, or policy environments. This assumption limits the long-term applicability of the models and suggests the need for regular retraining and validation.
The population density data is estimated based on historical trends and may not capture sudden demographic differences or migration patterns. This limitation affects the accuracy of population-related features and suggests the need for more frequent updates of demographic data.
The analysis focuses on Indian agricultural data, limiting the generalizability of the results to other agricultural contexts. While the methodologies and algorithms may be applicable elsewhere, the specific findings and parameter settings may not transfer directly to other regions or agricultural systems.
The dataset lacks crop quality indicators such as protein content, moisture levels, and post-harvest characteristics, which are important factors in determining the economic value of agricultural output. The models focus solely on yield quantity without considering quality attributes that significantly influence market prices and food security outcomes. This limitation affects the comprehensive assessment of agricultural productivity and suggests the need for future research incorporating quality metrics alongside yield predictions.
5.4 Computational Considerations and Scalability
The computational requirements of different algorithms present important considerations for operational deployment and scalability. These considerations affect the choice of algorithms for different applications and the infrastructure requirements for deployment.
Random Forest and Bagging algorithms can be parallelized effectively, making them suitable for deployment on multi-core systems. These algorithms’ parallel nature enables efficient training and prediction on large datasets, supporting real-time forecasting applications.
Gradient boosting algorithms (XGBoost, LightGBM, CatBoost) require more computational resources but provide superior performance. The choice between these algorithms and simpler ensemble methods depends on the specific requirements for accuracy, speed, and computational resources.
The deployment of these models in production environments requires careful consideration of computational infrastructure, including processing power, memory requirements, and storage capacity. These requirements affect the cost and feasibility of operational deployment.
6 Conclusion
This study benchmarks eleven ML algorithms for crop yield forecasting in India, demonstrating ensemble superiority and the benefits of including demographic features. RF was the top performer; LightGBM was the most stable. The comprehensive evaluation provides important insights into the effectiveness of different machine learning approaches for agricultural forecasting.
The superior performance of ensemble methods, particularly Random Forest, demonstrates the value of combining multiple decision strategies in agricultural forecasting. The significant performance gap between ensemble methods and individual models highlights the importance of sophisticated modeling approaches for complex agricultural data.
The integration of population features provides consistent improvements in forecasting accuracy, supporting the inclusion of demographic factors in agricultural forecasting models. While the improvement is modest, it represents a meaningful enhancement that contributes to better agricultural planning and policy development.
The research contributes to improved agricultural forecasting by demonstrating the value of comprehensive model evaluation and ensemble methods in agricultural prediction. The findings support the development of multi-model forecasting systems that can provide more robust and reliable predictions for agricultural planning and policy development.
7 Future Work and Research Directions
Future research should explore crop-specific models, integration of real-time climate and remote sensing data, soil index integration, explainable AI for stakeholder trust, and scenario modelling for climate impact assessment. These directions build on the current findings and address important gaps in agricultural forecasting research.
The development of crop-specific models could significantly improve forecasting accuracy by capturing the unique characteristics and requirements of different crops. The high importance of crop type in the current models suggests that specialized approaches for different crop categories could provide substantial improvements in prediction accuracy.
The integration of real-time climate data and remote sensing information could enhance the models’ ability to capture environmental factors affecting agricultural productivity. These data sources provide more timely and detailed information about growing conditions, potentially improving short-term forecasting accuracy.
The development of explainable AI techniques, including SHAP values and partial dependence plots, could improve stakeholder trust and support better decision-making. These techniques provide clear explanations of model predictions and the factors influencing them, supporting transparency and accountability in agricultural forecasting.
Scenario modeling for climate impact assessment could help policymakers understand the potential effects of climate change on agricultural productivity and develop appropriate adaptation strategies. These models could incorporate various climate change scenarios and assess their impact on crop yields and food security.
References
[1] L. Breiman. Random forests. Machine Learning, 45(1):5–32, 2001.
[2] T. Chen and C. Guestrin. Xgboost: A scalable tree boosting system. In Proceedings of the 22nd ACM SIGKDD International Conference on Knowledge Discovery and Data Mining, pages 785–794, 2016.
[3] D. De Clercq and A. Mahdi. Feasibility of machine learning-based rice yield predic- tion in india at district level. arXiv preprint arXiv:2403.07967, 2024.
[4] N. M. Gharakhanlou. Leveraging ensemble machine learning for enhanced crop yield prediction. Science of The Total Environment, 937:172587, 2024.
[5] D.Headey, P.Hazell, etal. Populationdensityandagriculturalproductivity: Theory and evidence. Agricultural Economics, 33(2):121–134, 2005.
[6] G. Ke, Q. Meng, T. Finley, T. Wang, W. Chen, W. Ma, Q. Ye, and T.-Y. Liu. Lightgbm: A highly efficient gradient boosting decision tree. In Advances in Neural Information Processing Systems, volume 30, 2017.
[7] Government of India. Agriculture statistics at a glance, 2023.
[8] L. Prokhorenkova, G. Gusev, A. Vorobev, A. V. Dorogush, and A. Gulin. Catboost: Unbiased boosting with categorical features. In Advances in Neural Information Processing Systems, volume 31, 2018.
[9] S. Sharma, S. Rai, and N. C. Krishnan. Wheat crop yield prediction using deep lstm model. arXiv preprint arXiv:2011.01498, 2020.
[10] T. A. van Klompenburg, A. Kassahun, and C. Catal. Crop yield prediction using machine learning: A systematic literature review. Computers and Electronics in Agriculture, 177:105709, 2020.
[11] Y. Wang, H. Zhang, Q. Li, and Y. Sun. Progress in research on deep learning- based crop yield prediction: Trends, challenges, and future directions. Agronomy, 14(10):2264, 2024.
About the author
Advika Lakshman
Advika is currently pursuing Artificial Intelligence and Data Science at Shiv Nadar University, Chennai. Her academic interests span across machine learning, deep learning, natural language processing, big data analytics, and speech technology. She has worked on diverse projects such as early sepsis prediction using clinical time-series data, sketch-to-face translation with DCGANs, geophysical data inpainting with Masked Autoencoders, and salary prediction using ensemble models. Advika has also interned at the National University of Singapore (Big Data, Deep Learning, Generative AI) and the Spring Lab at IIT Madras, where she developed ASR pipelines using HuBERT and ESPnet for multilingual speech data.
Outside academics, Advika is a professional Bharatanatyam dancer, with over 12 years of training and multiple state and national-level awards, including recognitions from Doordarshan. She also actively contributes to university events and communications through marketing and public relations initiatives.