

Author: Aryan Bajoria
Mentor: Dr. Adam Soliman
Lakshmipat Singhania Academy
Abstract
Indian startup ecosystem has exploded in the past decade, calling for a deeper understanding in the factors associated with this growth. Previous research on literacy rates in India have found a strong correlation with economic growth (Desai, 2012). This led me to the hypothesis that literacy might also affect startup activity in a region. In this study, I will compare the growth in the number of startups in India and literacy separately, then conduct a regression analysis on the literacy rates and startup counts across four major sectors (AI, Green Technology, Healthcare and Lifesciences, and IT Services) in multiple Indian states to determine whether there is a relationship between the two. Contrary to what I initially hypothesized, I did not find a strong association between the number of startups in a region to the literacy rate. These results might help us guide government policies and resources more effectively and it challenges the assumption that entrepreneurial growth is linked with literacy.
Keywords: Literacy Rates, Startup Growth, Regional Development, Entrepreneurship
I. Introduction
A. Background Information
India has seen rapid growth in startup activity since the mid-2010s, driven by digital adoption, funding flows, and sectoral innovations (especially in technology and AI). The number of new startups in India in the year 2016, identified by the Department for Promotion of Industrial and Internal Trade (DPIIT), was 502, while in the year 2023 it was 34842 (Department for Promotion of Industry and Internal Trade [DPIIT], n.d.-b).
This growth in startup activity has been associated with growth in a vast number of other fields. This includes technology, innovation, job creation, economic development, and overall societal progress. Startups lead to the disruption of pre-existing industries and form the path for advancement, along with acting as major job creators. Thus, promoting startups is essential for the overall economic and social development of a country (Kumar & Yadav, 2024).
To boost startup growth, the Government of India has undertaken multiple initiatives, which include the Startup India Initiative (Department for Promotion of Industry and Internal Trade [DPIIT], n.d.-a), which involves several programs to support entrepreneurs and provide benefits like startup recognition, tax exemptions, easier regulatory compliance and funding support to entrepreneurs. Apart from this, it has also launched programs like Make in India (2014) and Digital India (2015), encouraging domestic manufacturing and boosting digital infrastructure.
On the other hand, Indian literacy rates have had a consistent increase since the 1980s, rising from 43.6% in 1981 to 63.82% in 2011 (Registrar General & Census Commissioner, India, n.d.). In India, the literacy rate is calculated as the percentage of people aged 7 and above who can both read and write with understanding in any language. Literacy rates have been associated with economic growth and rural development in the country.
While the relationship between literacy as a factor of human capital and economic participation has been thoroughly explored, its direct relationship with startup activity is still underexplored.
Determining the factors that could be associated with the growth in startup activity could help us boost startup growth in regions with comparatively lower growth. It would also help us determine how to direct government funds more effectively, promoting maximum growth in both startup activity and literacy targeted across various industries and sectors.
In this study, I aim to investigate the extent to which state-level literacy rates in India correlate with the density and sectoral distribution of startups.
B. Thesis Statement
This study explores the relationship between literacy rates and the density and distribution of startups based on state and sector in India.
This study treats the two phenomena separately: first documenting the growth of startups, then documenting literacy trends. While both literacy and the number of startups in India have risen over time, regression analysis shows that there isn’t a strong relationship between the two, suggesting that literacy isn’t a suitable predictor of the number of startups.
II. Methodology
A. Growth of Startups
In India, the surge in the number of startups started in the 2010s. This was promoted by new government policies and the IT boom in the 2000s.
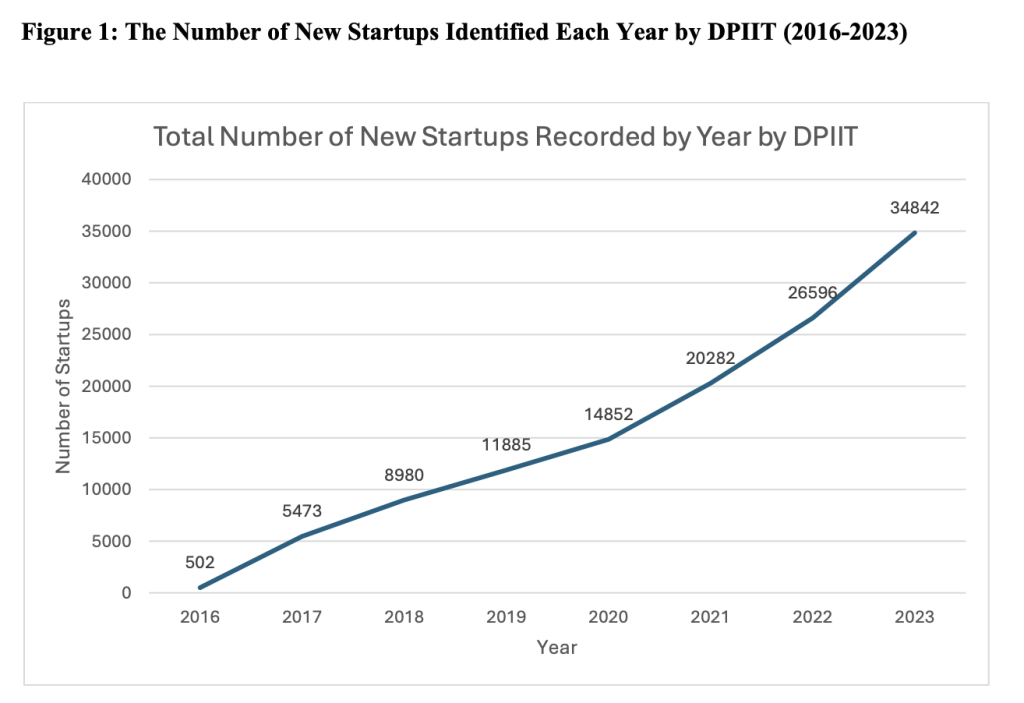
Figure 1 is a graph of the total number of new startups identified every year by DPIIT from 2016-2023. We can see that the number of startups grew rapidly in the period, with around 502 new startups in 2016 to 34842 new startups in 2023. For the purpose of comparing the growth, I have assumed that the number of startups in any state and industry in any year is approximately equal to the cumulative sum of the new startups from the year 2016. In our data, the number of startups in the year 2023 is 123412, while the number of startups reported by DPIIT is 117254. This slight difference might arise due to the regular updates in the list of currently active startups, which might have caused the delisting of startups which were shut down, merged or lost eligibility. In the time considered by us (2016-2023), most of the startups are new, so we can assume that most of them have not lost their eligibility yet.
These startups were split into multiple sectors, with many of them being in emerging industries and well-established ones like IT Services, Healthcare & Lifesciences, Construction, Agriculture, Food & Beverages, and Education. Figure 2 shows a rough split between these industries in the year 2023.
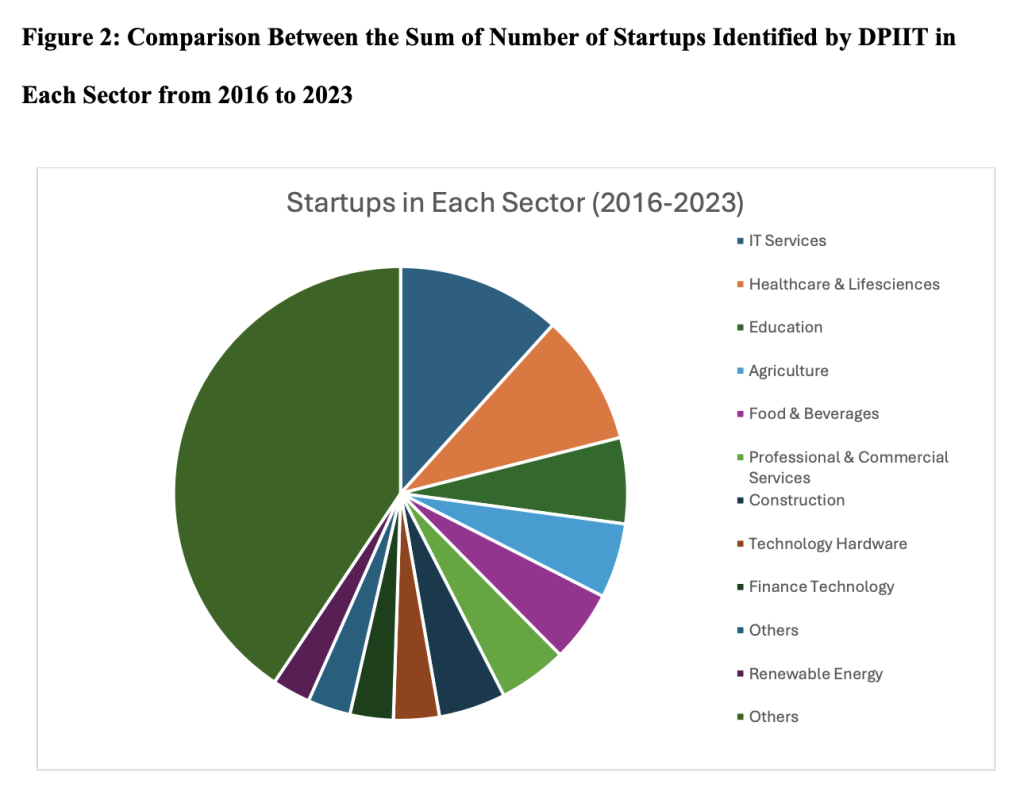
This study will focus on four large sectors, namely AI, Green Technology, Healthcare and Lifesciences, and IT Services. AI is an emerging sector, which has been growing rapidly for the past few years, while the other three (Green Technology, Healthcare and Lifesciences, and IT Services) are sectors which have grown consistently over a long period of time, thus allowing us to explore both recent and well-established sectors.
B. Growth of Literacy

In India, literacy rates have risen consistently since the country’s independence in 1947. On comparing the literacy percentages in India from the year 1951, we find that there is a linear growth in the same, as shown in Figure 4. Since the 2021 all-India census was delayed, we can assume that the growth till the year 2021 would have remained consistent and can thus project the value of the same. Here, the projected value for the year 2021 can be calculated by the average growth rate of 9.1% points per 10-year period. So, the graph projects an 82.1% literacy rate in the year 2021.
It is important to note that these values may differ from the actual literacy rates, and do not account for the changing policies or other external factors which may affect the literacy rate. For example, the Ministry of Statistics & Programme Implementation’s annual report for 2023 projects an overall literacy rate of 80.9%, suggesting a slightly lower growth during this time span. However, within the scope of this study, we can assume that the growth has remained consistent in the 10-year period of 2001-2011.
In an ideal scenario, the data for literacy would be available for the same period as the startup data from 2016. However, since the 2021 census in India was postponed, I will be comparing the percentage change in literacy rates across different states from the year 2001 to the year 2011.
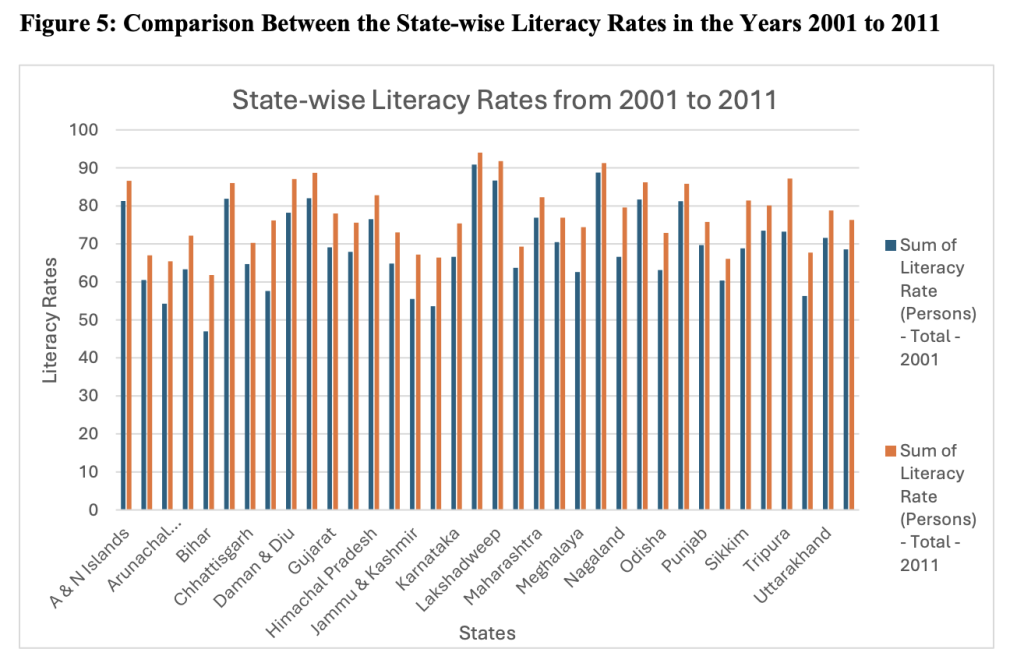
In Figure 5, we can see that there has been a growth in the literacy rate in every state in the decade 2001-2011. For my analysis, I have considered the growth in these states in this period and compared them with the growth in the number of startups from 2017-2023.
C. Regression Results
To determine the relationship between the literacy rate and the number of startups in a region, we have considered the percentage change in the number of new startups identified by DPIIT from 017 across four major sectors (AI, Green Technology, Healthcare and Lifesciences, and IT Services) to 2023 and run a linear regression analysis with the percentage change in literacy from 2001 to 2011 across multiple Indian States. Since we do not have accurate values for literacy during the period of startup growth, my analysis here is exploratory. Additionally, while the literacy rates consider a 10-year period and the startup data considers a 6-year period, during the selected timeframes, both exhibit a near-linear growth, allowing a meaningful comparison. The collected data was cleaned and missing/null values were dropped for every single sector.
It is worth noting that since the literacy rates were rising consistently both before and during the sudden rise in startup growth, as confirmed by projected results from DPIIT and MOSPI, it is unlikely that there is a reverse causal relationship between the number of startups and literacy rates, i.e., the number of startups does not strongly influence the literacy rate of a region.
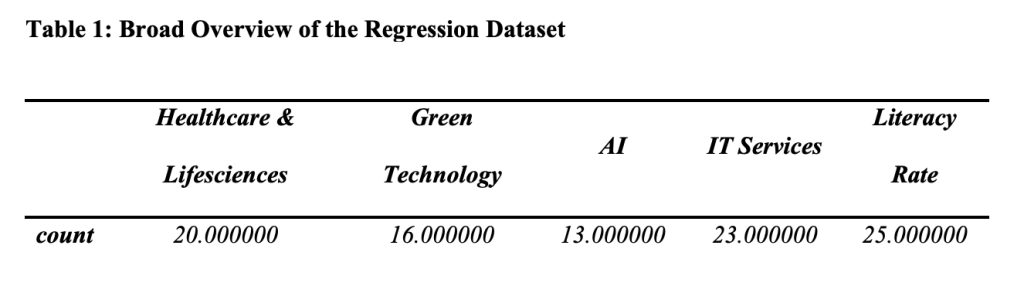
A broad overview of the data used in our analysis is listed in Table 1. In the analysis, I dropped the values from different states for each of the four industries separately for which the percentage change could not be calculated, due to null values in the starting year (2017).
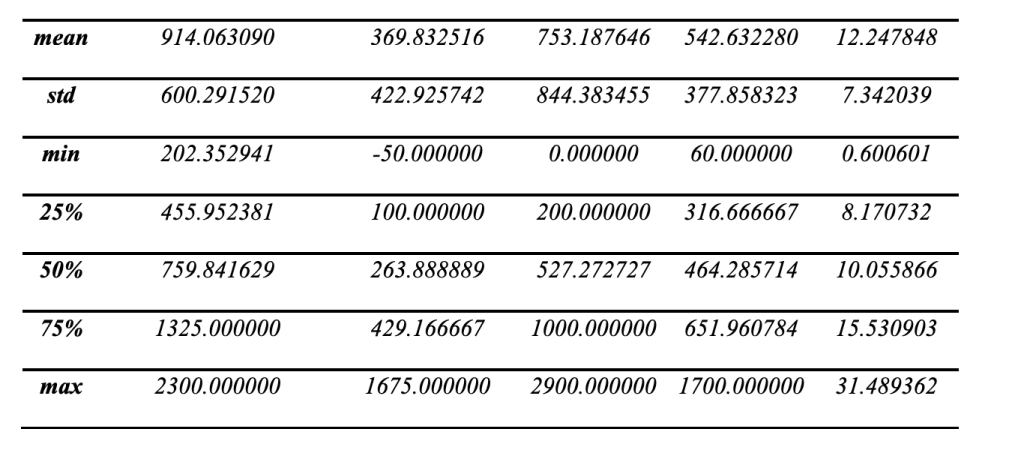
i. Startups in the AI Sector vs Literacy Rate

I have used the OLS (Ordinary Least Squares) regression for quantifying the linear effect of literacy on the number of AI startups in a region. From Table 1, we can see that we have considered a total of 13 states in this analysis. The p-value in this table is quite high (0.353), which makes this result statistically insignificant, i.e., there is no strong evidence of a linear association between the two variables.
ii. Startups in the Green Technology Sector vs Literacy Rate
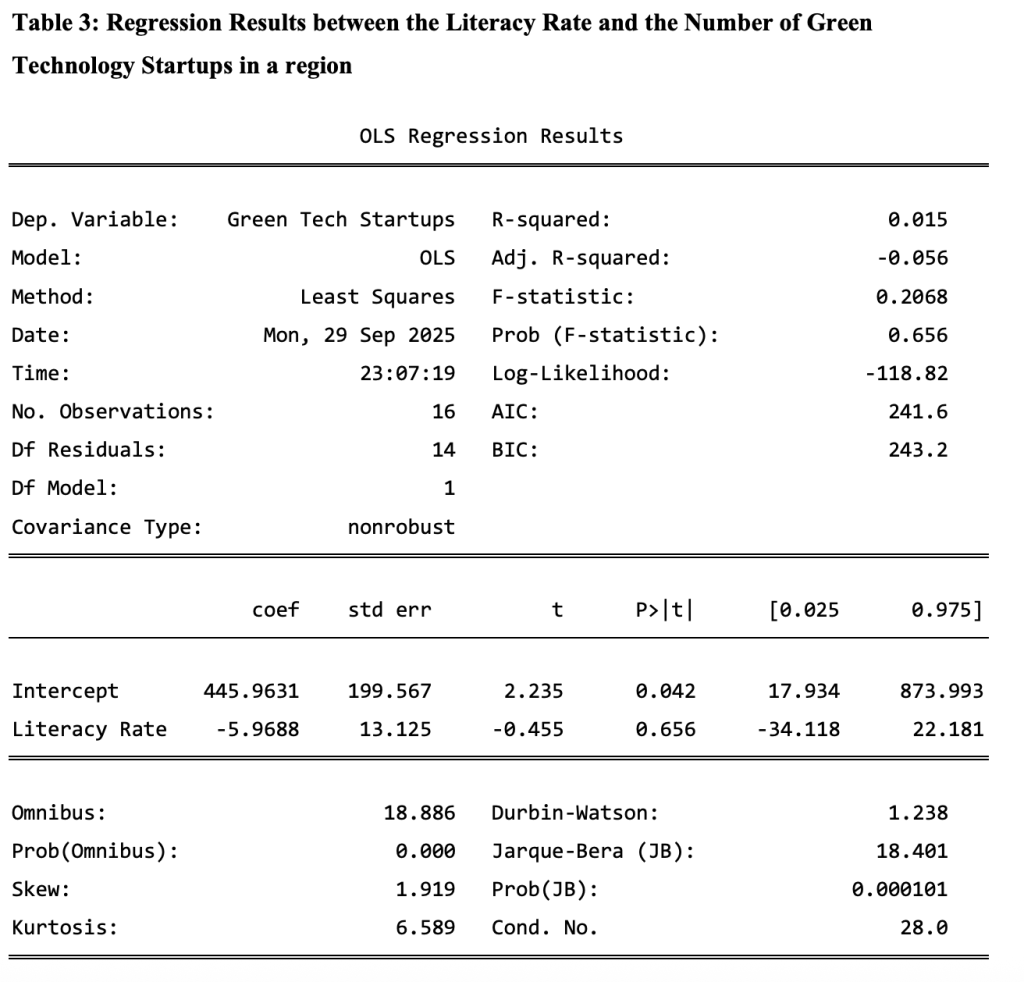
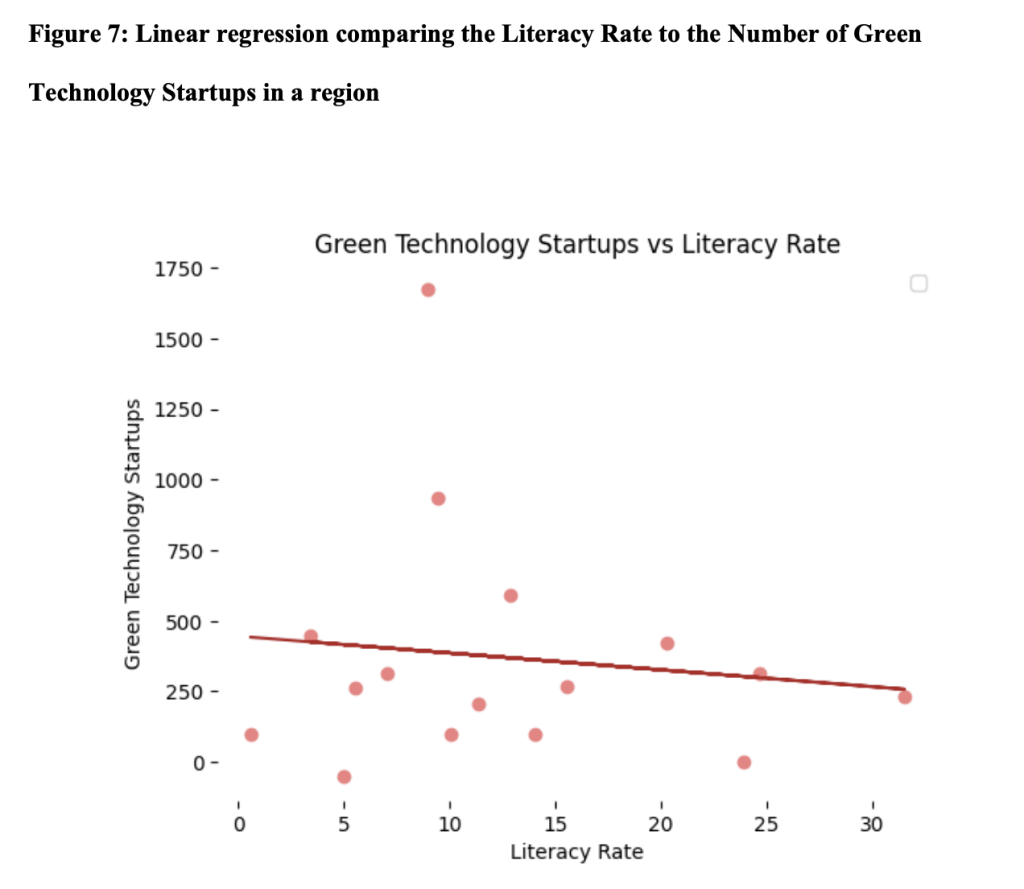
In Table 3 and Figure 7, we are trying to determine if a linear relationship exists between the Literacy Rate and the number of Green Technology Startups in a region. Here, I have considered 16 states for the regression. In this case too, the p value is extremely high (0.656), thus making the result statistically insignificant.
iii. Startups in the IT Sector vs Literacy Rate
Table 4: Regression Results between the Literacy Rate and the Number of IT Services
Startups in a region
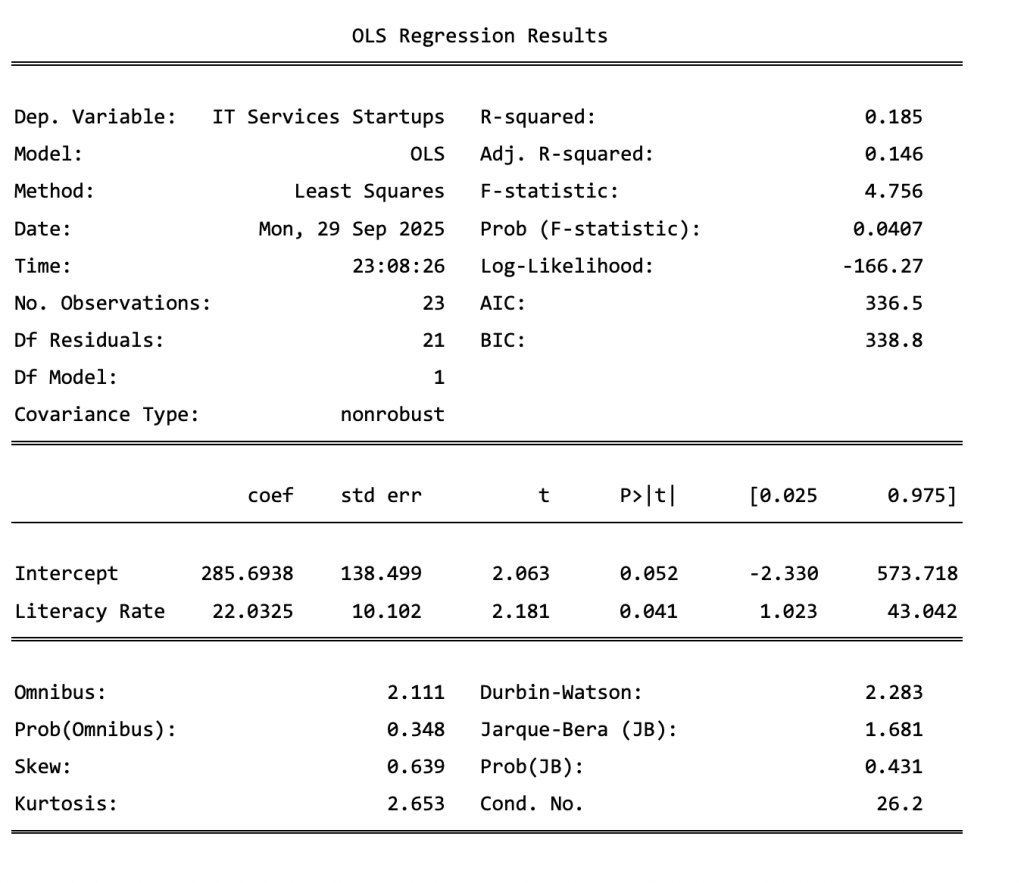
Figure 8: Linear regression comparing the Literacy Rate to the Number of IT Services Startups in a region
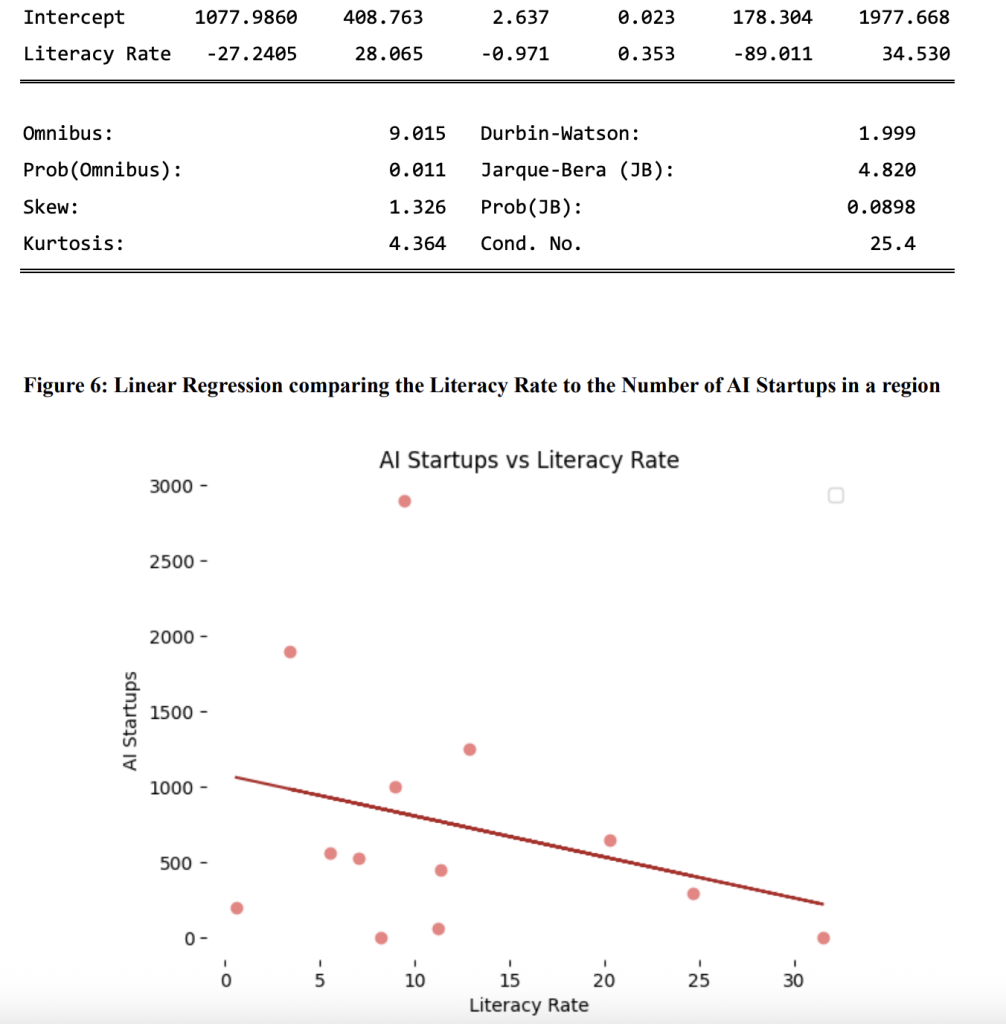
In Table 4 and Figure 8, we are trying to determine if a linear relationship exists between the percentage change in literacy rate and the number of IT Services startups in a region. Here, I have considered 23 states for the analysis. In this case, the p-value is much lower than the previous cases (0.041), which suggests that this result may be statistically significant. The slope here is approximately 22.03, i.e., a 1%-point increase in the literacy rate is associated with ~ 22 new IT startups per year. Additionally, literacy accounts for ~ 19% of variance in annual new IT Services startup counts (R² = 0.185).
iv. Startups in the Healthcare and Lifesciences Sector vs Literacy Rate
Table 5: Regression Results between Literacy Rate and the number of Healthcare and
Lifesciences Startups in a region

Figure 9: Linear regression comparing the Literacy Rate to the number of Healthcare and
Lifesciences Startups in a region
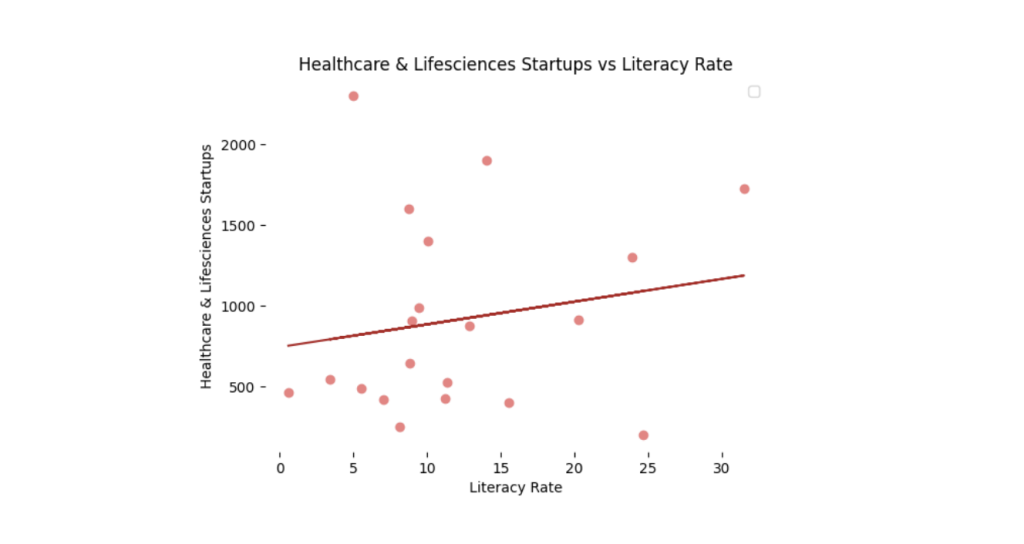
Finally, through Table 5 and Figure 9, the results of a regression analysis between the percentage change in literacy rate of a region and the percentage change in number of Healthcare and Lifesciences Startups identified in a year are presented. Here, we have considered 20 states for the analysis. This result is also statistically insignificant (p = 0.444).
D. Discussion
From the given regression tables, we can infer that the relationship between literacy and the number of startups varies across different sectors. Since the p-values of the regressions of literacy with the number of startups in the sectors Healthcare and Lifesciences, Green Technology and AI are large, we can say that any relationship in them is not meaningful. The relationship between literacy rate and IT Services startups might require further research, as the data considered shows a meaningful statistical relationship. This might indicate that literacy might be associated differently across sectors.
The findings aligned closely with those predicted by the log-normalized regression model as well. Given the small sample size and limited model, this relationship might not be extremely meaningful and requires further analyses. Additionally, it is important to note that since literacy data may not grow at the same rate as I predicted, this study only provides an exploratory insight.
III. Conclusion
Through this exploratory study, I compared the growth patterns for startups and literacy separately, with the initial growth in startups starting much after literacy. By analyzing the growth of startups in India, we realized that while their distribution is highly uneven across sectors and regions, the growth across them is fairly consistent. Additionally, this growth only began recently, unlike literacy, which has had consistent growth for a long time.
Comparing linear regression results of the number of startups in a region across four major sectors (AI, IT Services, Green Technology, Healthcare and Lifesciences) and the literacy rates, we did not find a strong association between the two, except in the IT Services sector.
This study was limited due the absence of recent literacy data, after the initiation of startup growth in the country. Additionally, since the growth of startups began only recently, we are unable to identify larger patterns in its growth.
These results could be further explored at a larger scale for identifying which industries will receive a boost from literacy. Future research identifying the reason for the variance of this relationship across sectors and accounting for tertiary variables would help us ascertain whether this association exists across a larger range of sectors. This might allow for a more effective allocation of Government funds, since the growth in literacy might also affect startup growth in certain sectors. Additionally, the increase in startups in a certain sector (for example Edtech) could possibly boost literacy rates as well. Eliminating confounders like the overall economic development of a region and demographic composition would provide stronger results.
IV. References
DPIIT. (n.d.-a). About startup India initiative. Initiative. https://www.startupindia.gov.in/content/sih/en/about-startup-india-initiative.html 9 Ministry of Commerce and Industry, Department for Promotion of Industry and Internal Trade (DPIIT). (n.d.-b). Industry, state and year wise startups recognized by DPIIT till last week [Data set]. Open Government Data (OGD) Platform India. Retrieved 4 July, 2025, from https://www.data.gov.in/resource/industry-state-and-year-wise- startups-recognized-dpiit-till-last-week
Desai, V. S. (2012). IMPORTANCE OF LITERACY IN INDIA’S ECONOMIC GROWTH.
Katiyar, S. P. (2015). Growth of Literacy in India – A Trend Analysis.
Kumar, D. D., & Yadav, D. A. K. (2024). The role of startups in driving technological advancement in the Indian economy. Journal of Social Review and Development, 3(Special 1), 15–19.
Government of India, Ministry of Statistics and Programme Implementation, & National Sample Survey Office. (n.d.). Annual Report, plfs, 2023-24. Annual Report, Periodic Labour Force Survey (PLFS), 2023-24. https://dge.gov.in/dge/sites/default/files/2024- 10/Annual_Report_Periodic_Labour_Force_Survey_23_24.pdf
Open Government Data (OGD) Platform India / Government of India. (2016, August 5). Literacy rate from 1951 to 2011 | open government data (OGD) platform India. Literacy Rate from 1951 to 2011. https://www.data.gov.in/resource/literacy-rate-1951-2011
Registrar General & Census Commissioner, India. (n.d.). https://www.data.gov.in/resource/literates-and-literacy-rates-sex-census-2001-and-2011.
About the author
Aryan Bajoria
Aryan is a Class 12 student at Lakshmipat Singhania Academy, India. His academic interests lie in data science, artificial intelligence, computer science, and entrepreneurship. Outside academics, Aryan likes to build tech projects and research startup ecosystems and AI.