

Author: Arik Zhang
Mentor: Dr. Paramveer Dhillon
Millburn High School
Abstract
Previous research has demonstrated that NBA payroll size positively impacts team championship contention and team success. However, the 2025 NBA Finals, which featured the Indiana Pacers and the Oklahoma City Thunder, provided the necessity to re-examine this correlation because neither teams’ total payroll was near the top of the league in the 2024–25 season. This paper investigates the impacts of NBA team payrolls, relative to the league salary cap, on team success as measured by regular season wins. Utilizing 11 years of financial and performance-related data from the 2014–15 to the 2024–25 season (inclusive), the study quantifies the correlation between spending and on-court results, and measures how well each team outperforms or underperforms their expected seasonal win totals based on annual spending. The study also investigates how the impacts of payroll efficiency on expected wins differ across various markets. Simulation results on different market sizes reveal that although higher payrolls remain generally associated with more wins, efficient resource management and strategic innovation are becoming increasingly more important.
1. Introduction
Over the past 11 years, the financial environment of the National Basketball Association (NBA) has undergone a dramatic transformation. This has altered the framework in which teams operate both on and off the court. The league, once characterized by predictable hierarchies based on spending, now reflects a more dynamic and uncertain battleground where new rules, economic incentives and roster strategies are changing. Not only has the salary cap steadily risen, but evolving collective bargaining agreements have also introduced mechanisms to promote parity and fiscal responsibility, such as luxury tax penalties and cap-smoothing regulations. In turn, team-building philosophies are continually adapting in response.
At the core of NBA team strategy lies a tension between financial investment and competitive success. Ownership groups have long discussed the merits of exceeding salary cap thresholds and incurring luxury tax payments in pursuit of a championship. Historically, empirical research has supported this perspective: a strong positive correlation between payroll spending and regular-season wins suggested that money could indeed provide an advantage in the standings (Gao, 2017), as exemplified by the Golden State Warriors’ championship success from the 2014–15 to the 2017–18 NBA season. The prevailing wisdom supported a team’s decision to stack rosters with elite talent in order to maximize the probability of postseason success.
Yet, the NBA is not static, and recent seasons have supported this idea. The 2024–25 campaign, specifically, delivers a striking counter-example: for the first time in the modern era, both NBA Finals teams, the Indiana Pacers and the Oklahoma City Thunder (OKC), reached the championship without paying any luxury tax charges. This development signals a broader shift: careful roster construction, player development and organizational discipline can offer a viable path to contention despite financial limitations. The 2025 NBA Finals raise questions about the key factors of success: has the relationship between payroll and success weakened, or is this season nothing more than an anomaly?
By tracing the relationship between team payroll and regular-season wins across eleven seasons, this research dives into whether spending is still a predictive factor for competitiveness. Each season is analyzed as a unique competitive environment, accounting for contextual changes that affect both individual team behavior and overall league economics.
The analysis compares the recent triumphs of non-luxury-tax teams within this historical and strategic context, illuminating larger trends in NBA parity and fiscal management. By looking into both the enduring and changing aspects of the payroll-to-wins paradigm, this study provides insights to help understand the future of basketball competition.
2. Related Works
Previous research on NBA payroll and performance has primarily focused on the overall relationship between team payroll size and winning percentage, generally confirming a positive correlation where teams with higher payrolls tend to win more. Several studies examine how salaries differ between teams, supporting the theory that salary inequality can reflect strategic investments in star players to maximize outcomes (Leon, 2025). Other research uses methods such as data envelopment analysis to evaluate how well teams convert financial and human resources into organizational success, including both on-court performance and franchise value (HarvardSports, 2023). These investigations highlight how intelligent roster construction, player development, and management practices significantly influence results beyond raw payroll numbers. Additionally, changes in Collective Bargaining Agreements (CBA) and luxury tax regulations have been studied for their impact on spending behaviors and competitive balance.
Most prior work, however, treated the league as a relatively homogenous entity or only broadly controlled for market effects without segmenting teams by detailed market tiers. Despite market size being a key variable in NBA economics and sports analytics, explicit analysis of payroll efficiency differences across large, medium, and small-market tiers remains limited.
This paper first studies the general relationship between payroll efficiency and wins, then further explores the effect of market sizes by introducing market tier as a moderating factor, offering a more detailed perspective on how spending effectiveness varies across different market sizes. It also demonstrates the analytical challenges posed by unequal team distributions among tiers and suggests more nuanced comparisons near market boundaries. These contributions provide new insights into the role of market size in NBA financial strategy and team performance.
3. Methodology
In this section, we discuss data collection and simulation methodologies.
3.1 Data Collection
Relevant data was scraped from two primary sources: Spotrac for financial data, including team payroll and salary cap figures, and Basketball-Reference for team win-loss records and additional season info (2025–26 NBA team salary cap tracker, 2025; Basketball statistics and history, n.d.). Python was used for web scraping owing to its flexible libraries and compatibility with structured data collection. Python libraries, such as requests and BeautifulSoup, were used for data scraping and cleaning of payroll, salary cap and win/loss data. Focusing on the most recent CBA and modern markets, without loss of generality, our data traces back to the history of each NBA team from the 2014–15 season to the 2024–25 season. We chose to start from the 2014–15 season to allow the immediate effects of the 2011 CBA to settle. Moreover, data sanity checks were applied using pandas to ensure year-over-year consistency and match teams across sources, resolving naming discrepancies, and verifying that payroll values aligned with reported league cap figures. Once compiled into a structured dataset, the information was imported into R for the analysis phase. Combined with R tidyverse packages, scatterplots were created to visually explore the relationship between each team’s payroll, as a share of the NBA salary cap, and regular season wins. These graphs revealed visible trends and helped identify potential correlations or outliers, making it easier to observe how spending efficiency and team success varied across different market sizes and eras.
3.2 Variable Construction
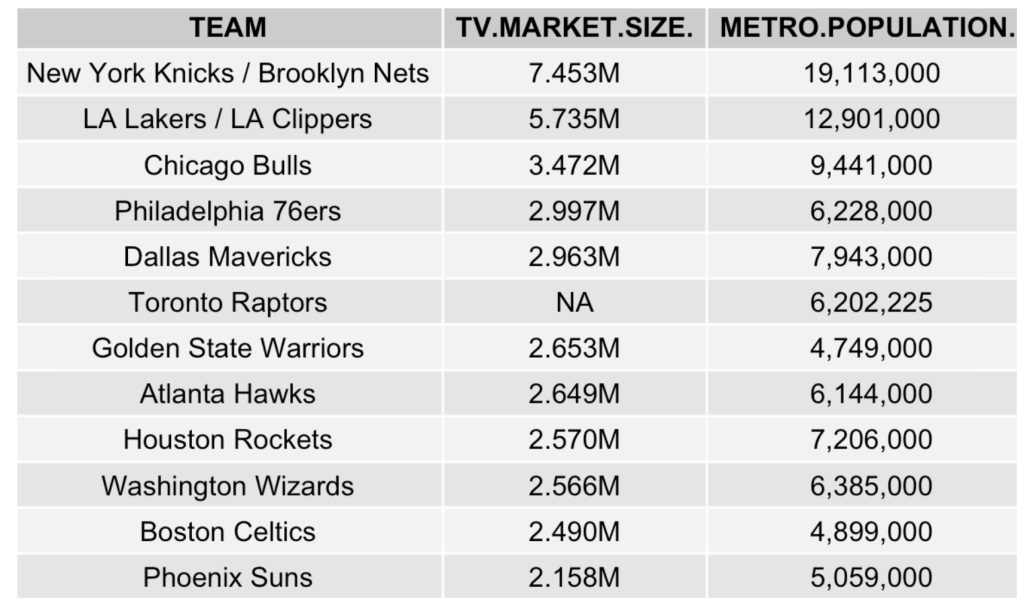
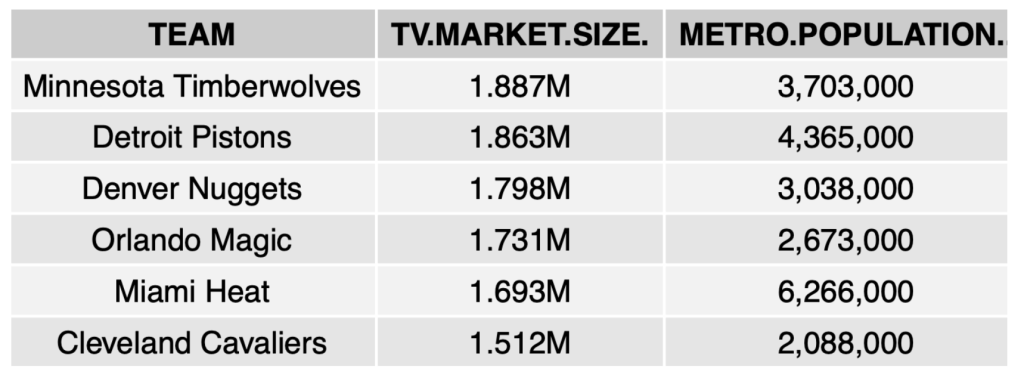
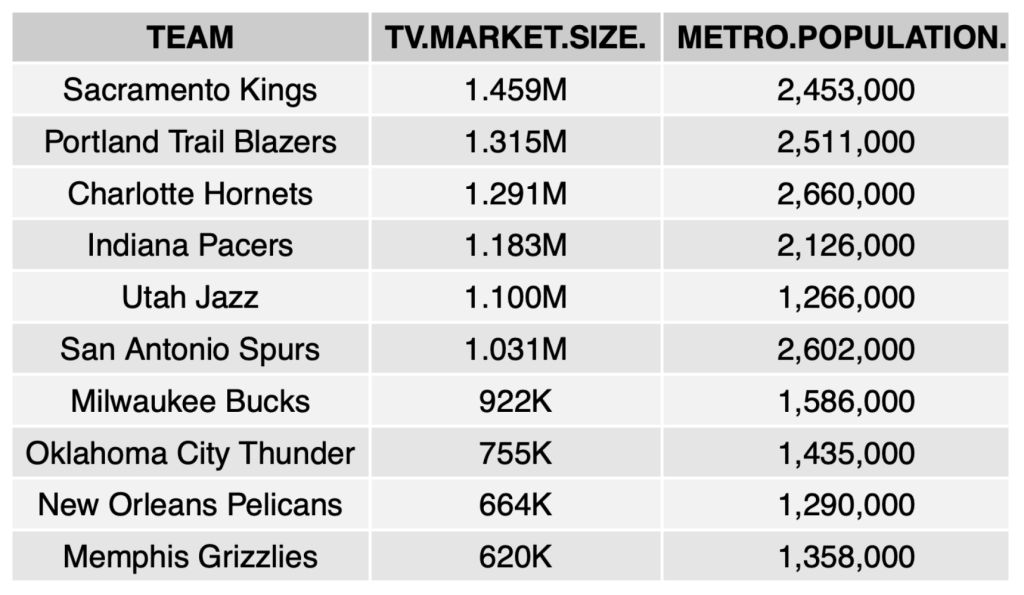
To investigate the potential effect of market size, teams were classified based on NBA market valuations and metropolitan statistical areas, according to HoopSocial (Burns, 2025). Specifically, large markets reach over 2 million homes, medium NBA markets reach between 1.5 to 2 million homes and small NBA markets reach less than 1.5 million homes. Market size categorizations were assigned to each franchise and included as categorical variables in the final analysis. Top-market (e.g., New York Knicks, Golden State Warriors, Los Angeles Lakers) and small-market franchises (e.g., New Orleans Pelicans, Indiana Pacers, OKC) were explicitly tagged based on local economic market size.
4. Experiment Results and Discussions
This section analyzes the findings on the relationship between payroll efficiency, market tier and overall cap efficiency in the NBA from 2014–15 through 2024–25. It examines the connection between payroll efficiency and wins, then compares results across market tiers, and finally evaluates advanced cap efficiency metrics to assess how teams convert spending into competitive success.
Cap efficiency is how effectively an NBA team utilizes its financial resources to achieve on-court success. It’s quantified by the residuals from a regression model that predicts team wins based on the percentage of the salary cap used. Specifically, it’s formulated as
Payroll Efficiency = team payroll / Salary Cap
4.1 Payroll Efficiency vs. Wins
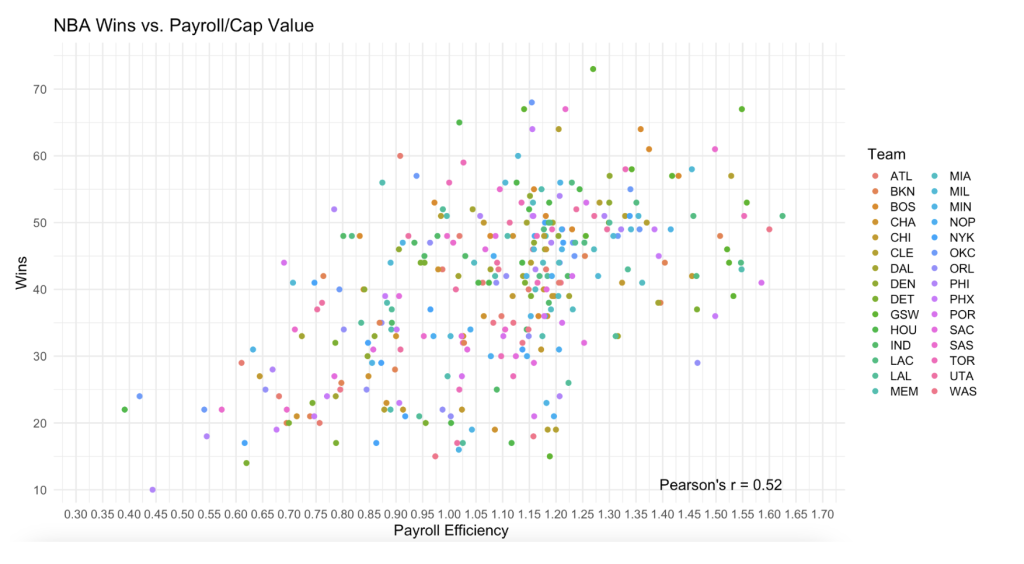
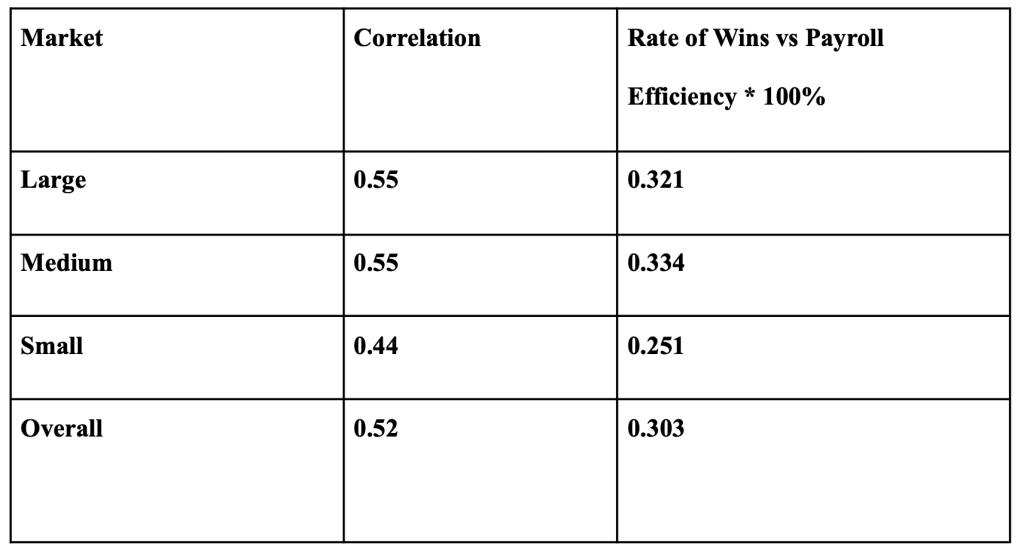
Figure 1 is a scatterplot that shows NBA teams from the 2014–15 through 2014–25 seasons. Overall, teams that allot a large portion of their available salary cap to payroll generally achieve more wins during the regular season. With a correlation coefficient of r=0.52, Figure 110 illustrates a stronger relationship between payroll as a proportion of the salary cap and the number of regular season wins compared to previous studies. The figure also illustrates the growing advantage of increased payroll spending in order to maximize wins in a season. For example, in 2024, the Boston Celtics won the NBA championship with the fourth-highest season payroll at a value of $184,845,028. By handing out large contracts to star players such as Jaylen Brown and Kristaps Porzingis, the Celtics invested in impactful contributors, helping elevate the team’s overall potential.
Despite this moderate correlation, the spread of data points is significant. Teams with average payrolls have, at times, recorded high win totals through smart trades, effective coaching strategies, and strong player development. This is most clearly seen in the 2024–25 season, when neither NBA Finals teams paid the luxury tax, as shown in Figure 2.11
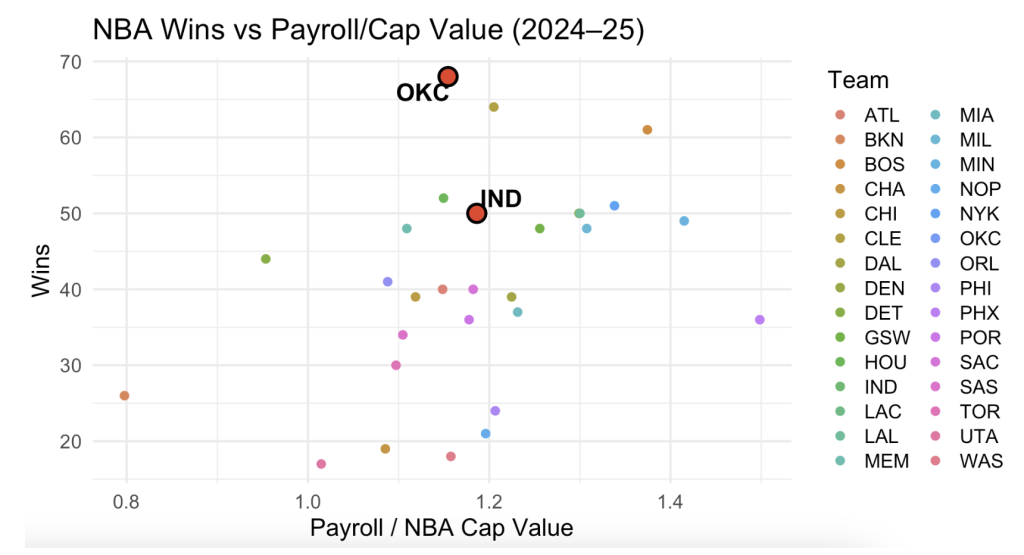
Figure 2 highlights the OKC and Indiana Pacers (IND) as outliers. Each team’s payroll efficiency value was situated close to league average, indicating that their payrolls relative to the salary cap weren’t among the highest in the league. Nevertheless, OKC achieved the most wins across the NBA, a surprising feat given their average payroll efficiency. This suggests that OKC was able to optimize its roster and performance well beyond spending expectations. The Pacers also secured a playoff spot by recording more wins than most teams with similar payrolls. Collectively, these two teams demonstrated exceptional efficiency and management, helping them convert average payroll investment into winning seasons and playoff appearances. As both teams adapt to changes in payroll regulation, the strength of each team’s development system also increases.
The graphs show that while increasing payroll can translate into potentially more wins, it doesn’t guarantee elite performance. Occasionally, teams that spend a lot underperform, and some mid-payroll teams overachieve. Hence, payroll is important, but not determinative.
Figure 1 and 2 underscore the relationship between payroll efficiency and wins while identifying notable outliers like the Thunder and Pacers. However, league-wide trends may differ depending on a team’s market size. To account for these structural differences, the next section explores results by market tier.
4.2 Market Tier Distribution
Categorizing teams based on market tiers allows for fairer comparisons among similar units. This enables more meaningful interpretations of trends such as payroll efficiency vs wins.
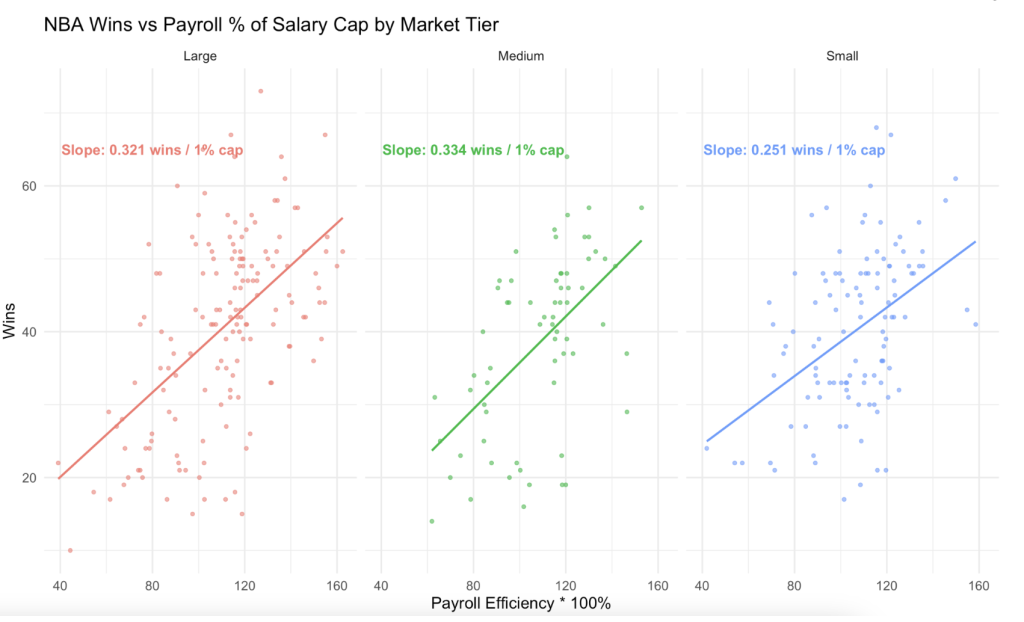
Figure 3 displays how payroll increases across different market tiers affect expected wins. Large- and medium-market teams experience greater gains in wins compared to smaller-market franchises when they increase spending. Notably, medium-market teams are projected to achieve bigger improvements when increasing payroll by 1% compared to large-market teams. Medium-market teams earn 0.334 additional wins compared to large-market teams that earn an additional 0.321 wins, a 0.013 win difference. This may be because large-market teams already operate near the limits of payroll efficiency, which means less room for further gains. Medium-market teams, on the other hand, often have more flexibility and potential to capitalize on increased spending. Small-market teams show smaller increases compared to the other two, reflecting a lower sensitivity to payroll changes. These differences could be due to factors such as small market teams’ limited access to top-tier talent, and limited flexibility for large- and small-market teams to grow because the former already maximizes payroll efficiency and the latter continues to face financial constraints. While spending more on players generally benefits teams, the exact extent varies based on market size and underlying competitive dynamics.
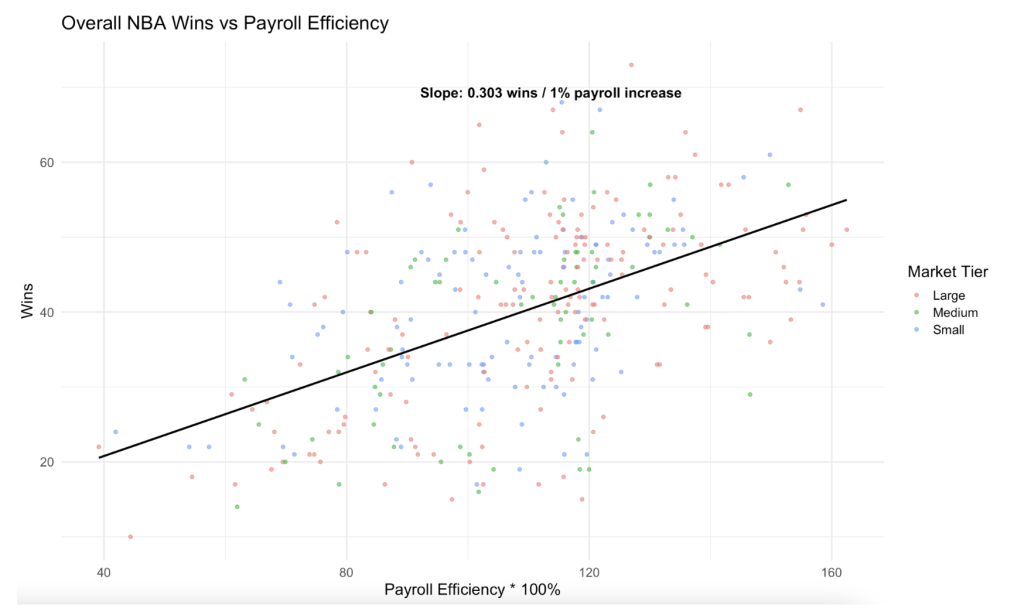
Figure 4 indicates that, in general, teams increasing their payroll spending by 1% can expect to win roughly 0.303 additional wins in the same season. This quantifies the practical impact of efficient payroll spending, showing how even a small increase in payroll can translate into tangible competitive benefits over the course of a full season.
Although market tier explains some variation in payroll efficiency’s effect on wins, it doesn’t fully capture a team’s performance relative to payroll expectations. For this, we examine the Cap Efficiency metric, quantifying value gained per payroll dollar against expected wins.
4.3 Cap Efficiency Metrics
Cap Efficiency represents the percent difference between expected wins and actual wins relative to payroll. A team with high Cap-Efficiency wins more games than expected for its spending, suggesting they are getting more value per dollar spent in terms of team regular season success and roster construction. Conversely, low Cap-Efficiency signals that a team is underperforming relative to the amount they spend. This metric sheds light on financial management’s strategic role in competitive outcomes.
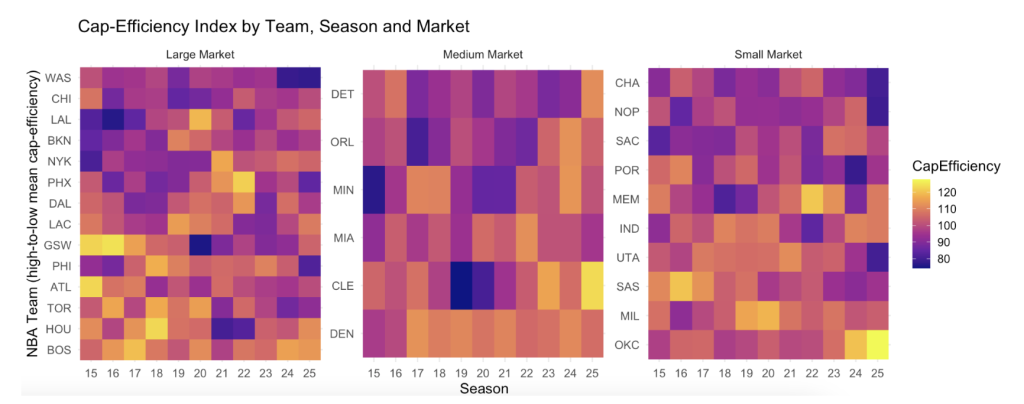
Figure 5 visualizes the Cap-Efficiency Index for NBA teams across different seasons and Nielsen market tiers. Each heatmap block corresponds to a market tier, with teams listed along the y-axis and seasons on the x-axis. The color scale represents cap efficiency, where 100 is the league mean. Blocks that are lighter in color represent values above 100, indicating that a team is getting more wins per payroll dollar than the league average. Dark-colored blocks illustrate values below 100, suggesting less efficiency. Teams are sorted from high to low mean cap-efficiency within each market tier to highlight patterns and identify consistently efficient or inefficient franchises.
Based on Figure 5, clear outliers stand out in each market tier. For example, the Washington Wizards, despite being a large market team, win significantly less than expected. Meanwhile, teams like the Boston Celtics have won much more than payroll spending would predict compared to other large market teams. This further illustrates that wins are affected by more factors than just payroll efficiency. Additionally, among small-market teams, the OKC wins a lot more than expected in a given season, making them the most consistently successful team in the classification. In contrast, the Charlotte Hornets have underperformed relative to their spending. This highlights that teams within each market size show significant variability in how effectively their spending correlates to wins. It also allows us to conclude that additional factors beyond payroll spending play a huge role in a team’s success in any given season.
Teams across different market tiers gain varying numbers of expected wins for each 1% increase in payroll spending. The linear regression in graph 6 indicates that teams with payroll efficiency values near the league average tend to record win totals close to the league average of 41 wins. As payroll efficiency rises, so does the trend line: around every 10% increase in payroll ratio corresponds to about 2 to 3 additional regular season wins from the 2014–15 season to the 2024–25 season (inclusive). For example, teams that spend 10% above the average relative to the salary cap typically achieve a win percentage of around 0.540, or 44 to 45 wins.
5. Conclusions
This research illustrates that, historically, higher payrolls relative to the NBA salary cap are correlated with greater regular season success. However, when considering the success of non-luxury tax teams such as the Indiana Pacers and the OKC, this relationship is in flux. The evolution of the CBA has introduced stricter spending controls and harsher penalties for teams that exceed cap and tax thresholds. Now, success requires creative navigation of the CBA, emphasis on clever roster construction, internal talent growth and careful financial planning.
The insights from this analysis are valuable as the NBA’s financial environment becomes increasingly restrictive. Teams across all market sizes benefit from understanding that efficient cap management can still produce competitive and even championship-level squads. As the new CBA encourages parity and places increasing constraints on heavy-spending teams, franchises willing to innovate and maximize value are in a better position to thrive. Ultimately, the findings emphasize that while payroll remains an important ingredient, resourcefulness and a deep understanding of league rules has become even more critical for sustained NBA success.
Future research can benefit from more granular data on roster construction beyond payroll, such as player age, length of contract, injury history and performance metrics. Examining strategic adjustments to the tax penalties and stricter tax escalators would also clarify how teams optimize beyond salary allocation. Moreover, it’s important to note that the distribution of teams across market tiers is uneven, leading to skewed comparisons. More refined analyses between borderline-tier teams or pairwise comparisons would better capture market size effects on payroll efficiency.
Furthermore, while this paper considers market size as a moderator of payroll efficiency, other factors such as ownership philosophy, coaching impact and player development likely influence success. Advanced econometric models or machine learning could help better understand the complex, nonlinear relationships between financial decisions and performance. Monitoring the relationship between spending limits and competitive results will be increasingly important as the CBA tightens financial constraints. Teams able to innovate and maximize spending will be in the best position to succeed.
Acknowledgements
I would like to thank Professor Paramveer Dhillon of the University of Michigan for his inspiring guidance and encouragement throughout this research endeavor. Dr. Dhillon’s support is indispensable for the study to be completed the way it is.
References
Basketball Reference. (n.d.). Basketball statistics and history. Basketball-Reference.com. https://www.basketball-reference.com
Burns, M. (2025, June 5). 2025 NBA Team Market Size Rankings. HoopSocial. https://hoop-social.com/nba-team-market-size-rankings
CBA – National Basketball Players Association. (2023) Collective Bargaining Agreement (CBA). Nbpa.com. https://nbpa.com/cba
Gao, J. (2017). Exploring the impacts of salary allocation on team performance. Academia.edu. https://www.academia.edu/96573049/Exploring_the_Impacts_of_Salary_Allocation_on_Team_Performance
Harvardsports. (2023) Pay to Play: An Analysis of Payroll and Performance in the MLB and NBA. The Harvard Sports Analysis Collective. https://harvardsportsanalysis.org/2023/02/pay-to-play-an-analysis-of-payroll-and-performance-in-the-mlb-and-nba/
Leon, S. (2025, March 4). NBA payrolls: Spending big doesn’t always mean winning big. The Sports Cast https://thesportscast.net/2025/03/04/nba-payrolls-spending-big-doesnt-always-mean-winning-big/
Spotrac. (2025). 2025–26 NBA team salary cap tracker. Spotrac.com. https://www.spotrac.com/nba/cap
About the author
Arik Zhang
Arik is a senior at Millburn High School from Millburn, New Jersey. He is deeply passionate about statistics and its applications in business modeling and sports analysis. He also enjoys pursuing a variety of scientific research inspired by his classroom studies. He is a scholarship-holding member of the American Chemical Society and presented his work on molecular synthesis at ACS Fall 2025 in Washington, D.C.
In his capacity as a student leader, Arik is committed to fostering interdisciplinary work. As the head editor of the Sports section of his school newspaper, he integrates statistics and analysis into reporting to expand the depth of complexities of stories . As co-president of the Science Olympiad team, Arik combines rigorous scientific thinking with team-building to cultivate a collaborative, high-achieving culture.
Arik is also a strong believer in community service and education. As captain of the Millburn Limited Prep speech team, he coordinates and coaches year-round speech and debate classes at local schools. He also directed a summer speech camp for elementary- and middle-school students during the summer of 2025, the proceeds from which were donated to organizations serving local communities in-need.