

Author: Abhiram Kode
Mentor: Dr. Zack Michaelson
Rock Hill High School
This paper examines the stability of five leading stablecoins USDT, USDC, BUSD, TUSD, and DAI using a nonlinear machine learning model combined with an event based analysis of major depegging episodes. Fiat backed stablecoins show muted and short lived deviations from their pegs during external shocks, reflecting liquid reserves, arbitrage and institutional support, and often trade at small premiums. By contrast, the crypto collateralized DAI comoves strongly with systemic risk, embedding mark to market leverage, on chain frictions and liquidation dynamics that mirror contagion effects in the banking literature. Our approach validates and extends recent work on stablecoin fragility and shows how design choices translate into distinct patterns of resilience or vulnerability under stress, with implications for regulation and digital asset market structure.
1. Introduction
When Silicon Valley Bank collapsed in March 2023 it sent a shockwave through the stablecoin market. The news that Circle held part of USDC’s reserves at the failed bank drove its price down to about $0.87. DAI, which is backed by crypto collateral, also slipped below its peg. This episode, together with earlier events such as the 2018 USDT reserve rumor discount and the 2020 Black Thursday crisis in DAI, highlights a fundamental divide in how different types of stablecoins behave under stress.
Fiat backed stablecoins such as USDC, USDT, BUSD and TUSD mainly face redemption bottlenecks during moments of panic. Because their backing sits in cash or liquid assets, arbitrage and institutional support usually close the gap quickly, and these coins often trade at a small premium rather than a discount during calm periods. By contrast, crypto collateralized coins such as DAI embed mark to market leverage, liquidation risk and on chain frictions directly into their design. When the underlying collateral becomes volatile or gas fees spike, liquidations cascade, arbitrage slows, and prices can swing both below and above the peg. This reflects the panic-driven withdrawals and cascading effects described in Diamond and Dybvig’s model of bank runs.
In Section 1, the analysis introduces the contrasting behavior of fiat-backed and crypto-collateralized stablecoins under stress, using the USDC–SVB banking shock, the 2018 USDT reserve-rumor episode, and Black Thursday (2020) to illustrate why collateral design and on-chain frictions matter. Section 2 reviews the existing literature on stablecoin stability, systemic risk transmission, and nonlinear modeling, drawing on the work of Lyons and Viswanath-Natraj, Grobys et al., and Klages-Mundt et al. Section 3 outlines the data and methodology, combining a Gaussian Ridge Neural Network estimation of daily stablecoin prices against four macro-financial risk indexes with a structured event analysis of major depegging episodes between 2018 and 2024. Section 4 reports the main results, showing that fiat-backed stablecoins exhibit low SSE and weak correlations with systemic risk, whereas DAI shows high correlation and mixed-sign coefficients. Model predictions are compared with real-world events to demonstrate that macro shocks affect fiat-backed coins briefly, while on-chain shocks cause deeper, asymmetric deviations in DAI. Finally, Section 5 discusses the implications for stablecoin design, financial stability, and the regulation of crypto-dollar instruments.
2. Literature Review
Stablecoins resemble fixed exchange rate regimes because they promise convertibility at par, yet their credibility depends on collateral, redemption, and confidence. Lyons and Viswanath-Natraj (2023) show that fiat backed designs such as USDT and USDC remain close to par through arbitrage and redemption and often trade at small premiums. Grobys et al. (2021) document that crypto collateralized tokens such as DAI display nonlinear dependence on systemic risk indexes. These findings echo Diamond and Dybvig (1983), where stability is sustainable in good states but fragile when coordination failures and run dynamics emerge.
A second group of studies focuses on how stablecoin designs embed different risk channels. Klages-Mundt et al. (2020) classify stablecoins into fiat backed, crypto collateralized, and algorithmic types and show that risk profiles vary sharply across designs. Crypto collateralized coins encode mark to market leverage, on chain liquidation risk, and settlement frictions. Algorithmic designs attempt to engineer stability reflexively but can amplify feedback loops. The Terra Luna collapse in 2022 confirmed these theoretical warnings, while the USDC–SVB banking shock showed that even fiat backed coins can temporarily lose their peg. Liquidity concentration on venues such as Curve 3pool and Binance has also shown that market microstructure can transmit stress (Briola and coauthors, 2023).
A third group of studies applies advances in financial econometrics and machine learning. Mallqui and Fernandes (2019) and Shen et al. (2020) show that radial basis function neural networks outperform linear benchmarks in predicting asset prices and volatility. Corbet et al. (2021) survey machine learning applications in crypto markets and find that neural and recurrent architectures can identify volatility patterns that GARCH style methods may miss.
This paper extends the literature by applying a radial basis function neural network to five leading stablecoins (USDC, USDT, BUSD, TUSD, and DAI) and linking daily prices to four macro financial risk factors. By evaluating both the sum of squared errors and the correlation between predicted and observed series, the analysis captures predictive accuracy and structural co movement with systemic risk. Combining model-based results with event-based evidence from major depegging episodes shows that fiat backed coins mostly experience short lived redemption pressures, while crypto collateralized coins encode collateral volatility and on chain frictions.
3. Data and Methodology
This study employs a dual-method approach to examine stablecoin stability. On the quantitative side, the analysis constructs and trains a Gaussian Ridge Neural Network (GRNN) to model nonlinear sensitivity of stablecoin prices to macro-financial risk indexes. On the qualitative side, structured event observation complements the quantitative modeling.
It is important to note that the sample ranges differ across stablecoins, reflecting their varied launch dates. As a result, correlation estimates are not strictly apples-to-apples. For example, USDT and DAI have longer and more volatile histories than newer entrants such as BUSD and TUSD. This difference in data coverage should be taken into account when interpreting the comparative strength of correlations across stablecoins.
A. Quantitative framework
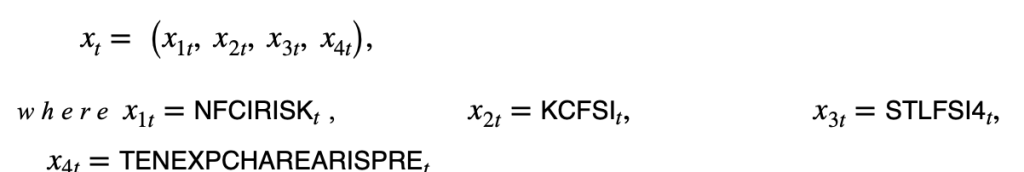
The quantitative analysis uses a Gaussian Ridge Neural Network (GRNN) to link stablecoin price with systemic financial risk indexes. Gaussian ridge functions capture the nonlinear behavior typical of stablecoins, which remain close to their peg under normal conditions but deviate sharply during systemic or crypto-specific stress. This design enables the model to detect nonlinear fragility that linear regressions fail to capture. The model uses daily values of four macro-financial indexes—NFCIRISK, KCFSI, STLFSI4, and the 10-Year Expected Inflation Risk Premium—from the Federal Reserve’s FRED database and use them as the feature vector (the model’s inputs).
The model estimates relationships between daily stablecoin prices to four macro-financial risk factors. Let
Each stablecoin (USDT, USDC, DAI, BUSD, and TUSD) is estimated independently using identical macro financial inputs and two hidden nodes. The model optimizes weights, centers, spreads, and biases by minimizing the sum of squared errors (SSE) between observed and predicted prices.
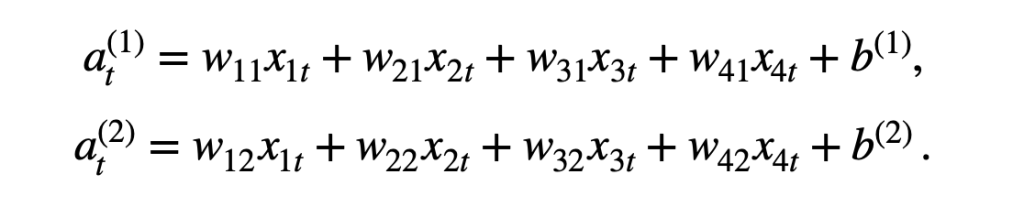
Step 1: Input Layer to Hidden Nodes (Linear Stage). For each hidden node j ∈ {1, 2}, the model computes a separate weighted sum of the four macro- financial risk factors plus a bias term:
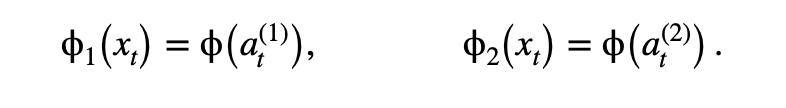
Step 2: Hidden Node Activation (Nonlinear Stage). ach hidden node transforms its input through a Gaussian ridge function:
Step 3: Output Layer (Linear Stage). The hidden node activations are combined to generate the predicted price (or deviation from par) of the stablecoin:
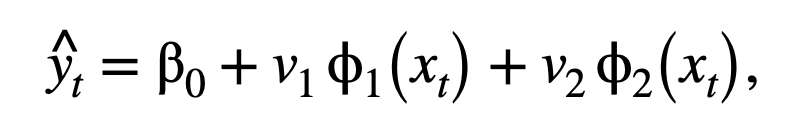
where β0is the output bias and v1, v2 are weights from hidden nodes to the output node.
Step 4: Error. The model’s error term for each observation is the difference between the predicted and actual price:
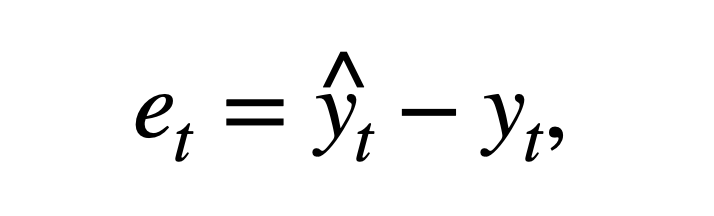
where yt is the observed stablecoin price.
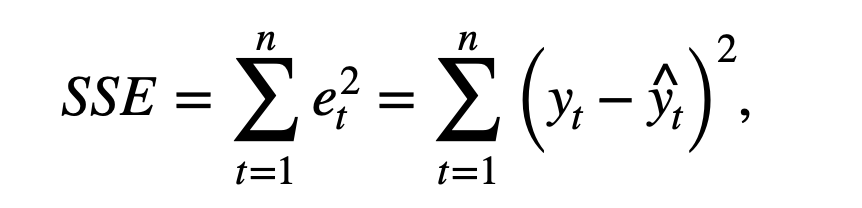
Step 5: Model Fit. The model measures overall fit using the Sum of Squared Errors (SSE):
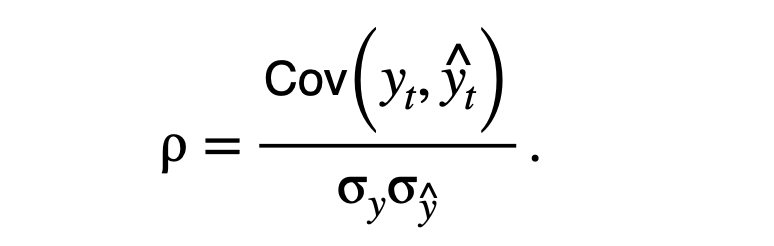
and by the Pearson correlation coefficient between actual and predicted prices:
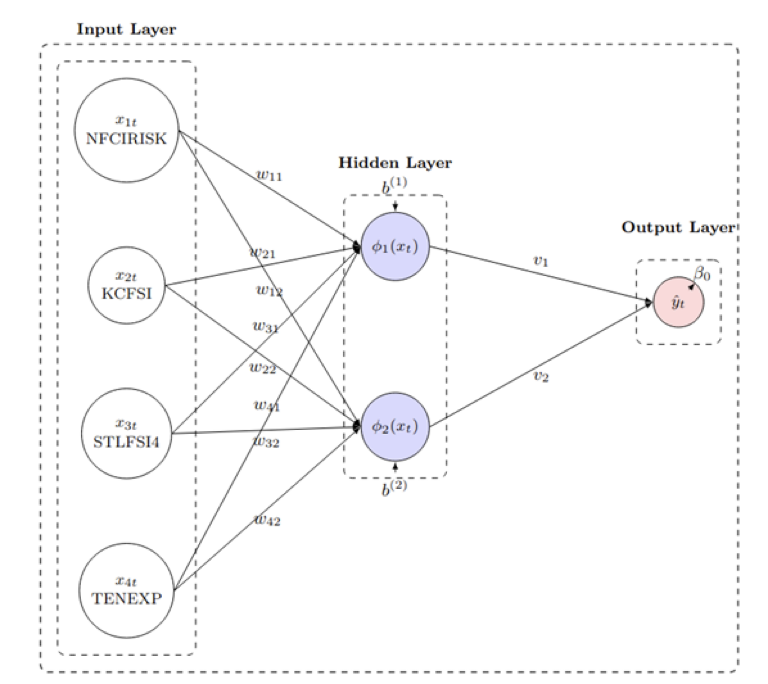
As shown in Figure 1, the network links four macro-financial risk factors to two hidden nodes and then to an output node representing the predicted stablecoin price or deviation from par.
B. Event Observation Framework
The analysis compiles a structured dataset of major stablecoin depegging episodes between 2018 and 2024 to complement the model-based analysis. For each event, the event window and the date of maximum deviation, the affected stablecoin or coins, the lowest observed price recorded on CoinMarketCap during the episode, and a classification of the primary trigger are documented. The analysis codes triggers as either macro-financial such as external banking shocks, market stress, or regulatory actions or on-chain/DeFi, including protocol-specific failures, liquidity imbalances, or infrastructure stress. This classification enables us to distinguish between stress transmitted through traditional financial channels and stress that originates within digital-asset markets.
The analysis draws events from multiple sources including industry reports, regulatory filings, market data providers such as DeFiLlama and Kaiko, and commentary from central banks. The framework organizes each episode into six thematic drivers of fragility: market stress and panic events, regulatory and legal drivers, blockchain and infrastructure dependence, issuer behavior and transparency, liquidity concentration and market microstructure, and adoption or utility shocks.
This event-based framework captures dimensions of fragility, confidence, governance, and infrastructure bottlenecks that lie outside the scope of purely statistical modeling. Together with the GRNN estimation, it provides a more holistic view of stablecoin stability, linking sensitivity to systemic risk factors with the historical record of crises and structural vulnerabilities.
4. Analysis Results
A. Quantitative Results: Stablecoin Sensitivity to Financial Risk Indexes (GRNN)
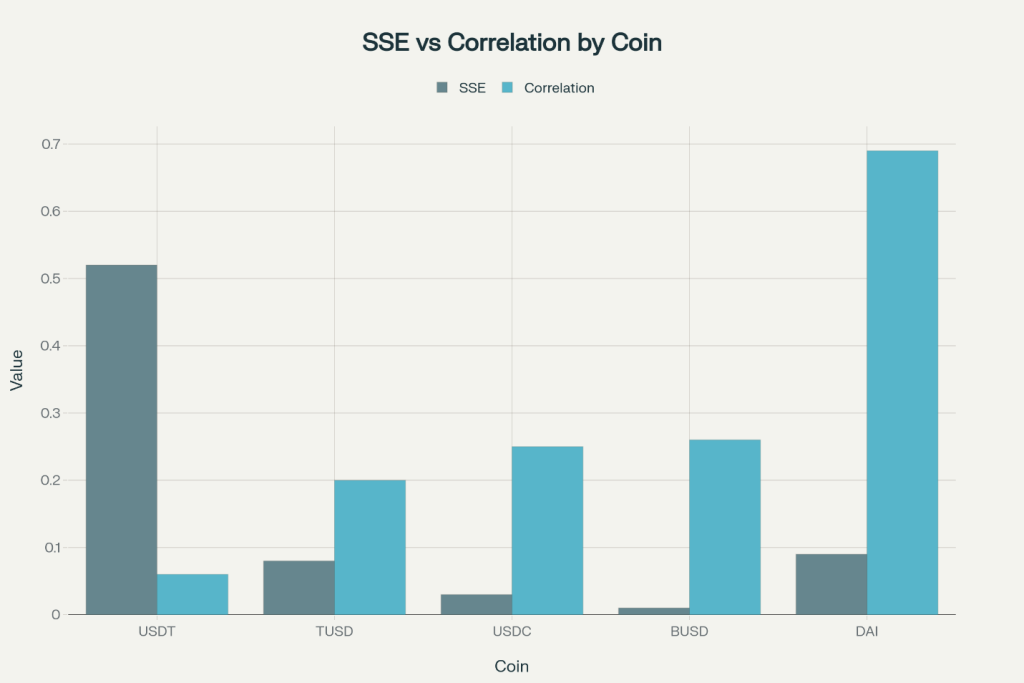
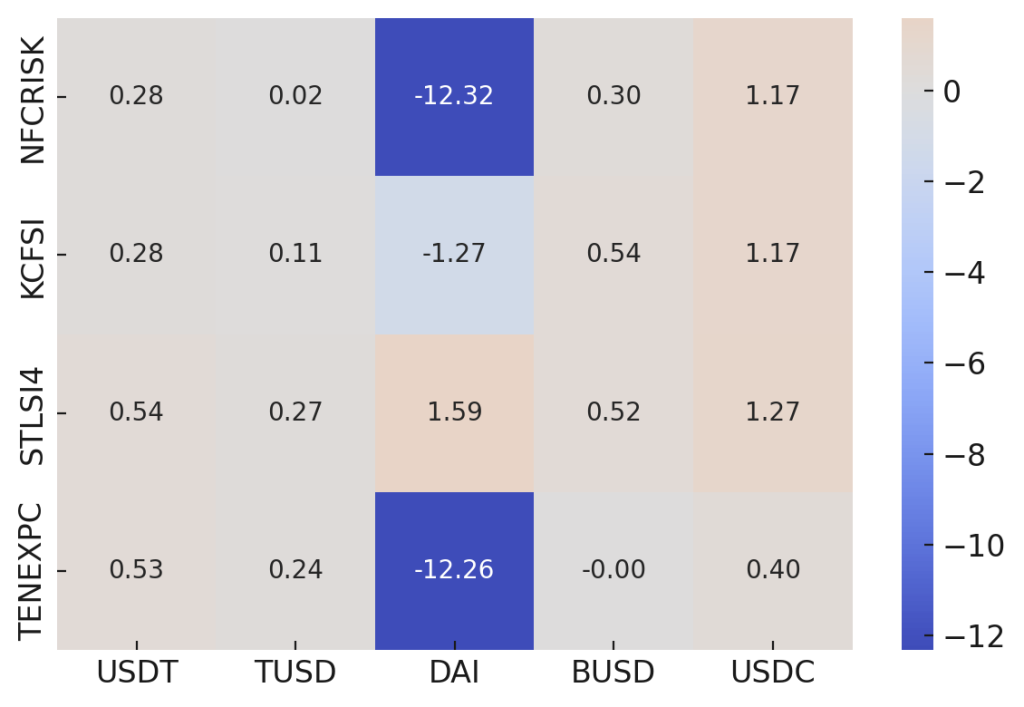
After minimizing SSE, the estimated input-to-hidden weights show a sharp contrast between fiat backed and crypto collateralized stablecoins. Fiat backed coinsload near one across systemic risk indexes, consistent with a muted and proportional response to macro conditions. By contrast, DAI exhibits large mixed-sign coefficients and a high bias term.
Figure 2 plots SSE against correlation for the five stablecoins, illustrating how DAI diverges from the fiat backed group. Figure 3 shows the average absolute input-to-hidden weights by risk factor and stablecoin, highlighting the near-unit values of fiat coins and the much larger magnitudes of DAI.
The large mixed sign coefficients for DAI provide evidence that leverage and on chain frictions transmit macro shocks directly into the stablecoin’s peg. Fiat backed stablecoins work much like a currency board or a hard peg regime: they hold reserves in cash or short term government securities and can meet redemptions quickly, which limits how far prices move when stress hits. Crypto collateralized coins such as DAI are closer to a soft peg backed by volatile assets.
Because DAI’s collateral is marked to market on chain, any rise in systemic risk immediately cuts collateral values and pushes collateral ratios toward liquidation. This sets off margin calls, liquidations, and delays in arbitrage that make price swings larger and longer. On chain bottlenecks such as gas fee spikes or thin liquidity slow down adjustment further and create the kind of liquidity spirals seen in past financial crises. The large mixed sign coefficients estimated for DAI are not random noise but evidence that leverage and on chain frictions transmit macro shocks directly into the stablecoin’s peg.
B. Event Observations: Linking Model Predictions to Real World Stress Episodes
A structured dataset of major depegging episodes between 2018 and 2024 was compiled, recording for each episode the event window, affected stablecoins, lowest observed price on CoinMarketCap, and the primary trigger categorized as either macro-financial or on-chain/DeFi. Table 1 summarizes these events. Macro events such as the SVB banking shock and BUSD’s regulatory action caused temporary but pronounced deviations in fiat backed coins. On-chain events such as Black Thursday (2020) and Curve 3pool imbalances (2023) produced sharper and more asymmetric deviations in DAI and USDT. Comparing GRNN predictions with observed prices shows that the model captures macro-financial sensitivity but underestimates DeFi-specific shocks, consistent with its input structure based on four systemic risk indexes.
TABLE 1—MAJOR STABLECOIN DEPEGGING EPISODES, 2018–2024
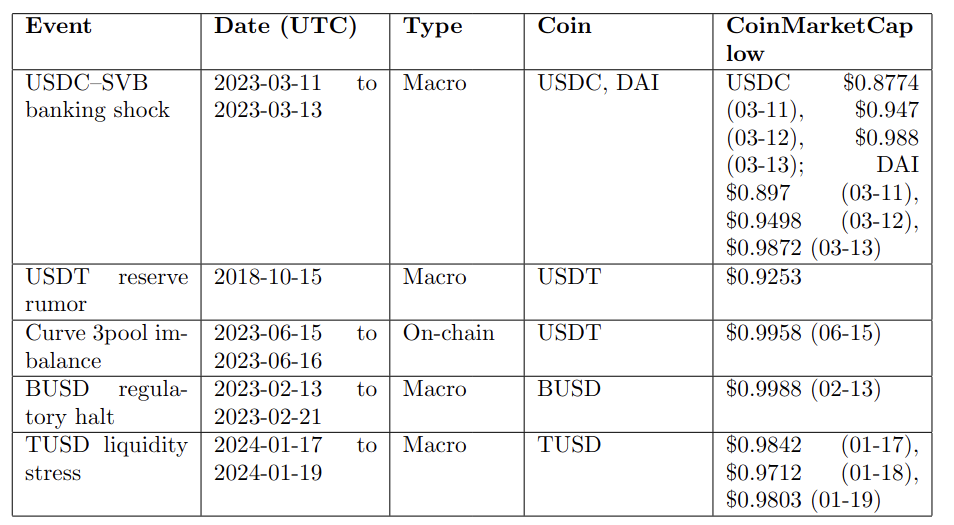
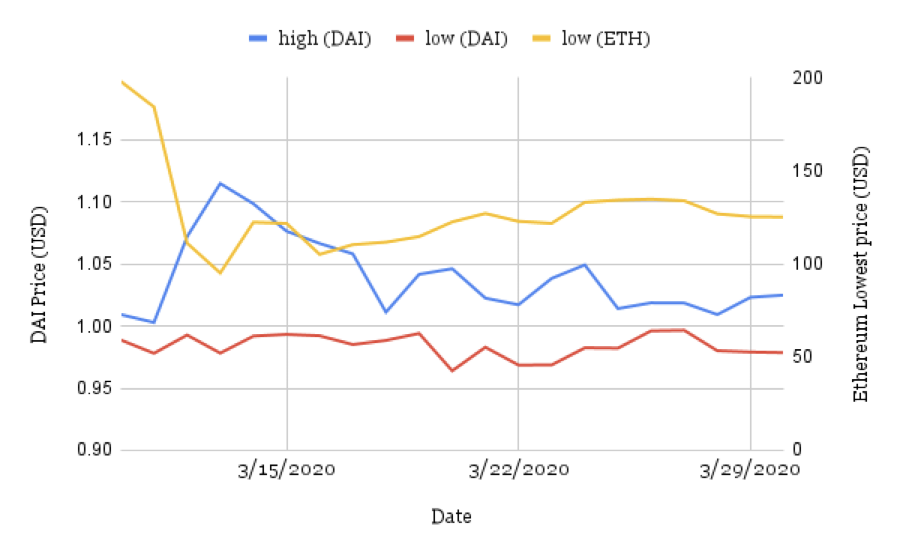
Figure 4, Figure 5 and Figure 6 compare DAI price behavior with Ethereum market conditions in March 2020.
The first figure plots daily DAI deviations from one dollar together with the Ethereum average gas price. Deviations rise when gas fees are elevated, which suggests that network congestion makes it harder to execute arbitrage or liquidations that would normally stabilize the peg. The second figure contrasts DAI daily highs and lows with the Ethereum low price over the same dates. Around mid-March, when Ethereum volatility jumps, the DAI high low spread widens at the same time, which points to stress in collateral mechanics and liquidity. Importantly, DAI moved both above and below one dollar. It fell below par when confidence weakened after collateral auctions failed to clear, and it rose above par when liquidators and arbitrageurs needed DAI to repay vault debt, which created temporary scarcity. Taken together, the patterns indicate that DAI instability during stress reflects not only broader market shocks but also on chain frictions such as high gas costs and collateral volatility.
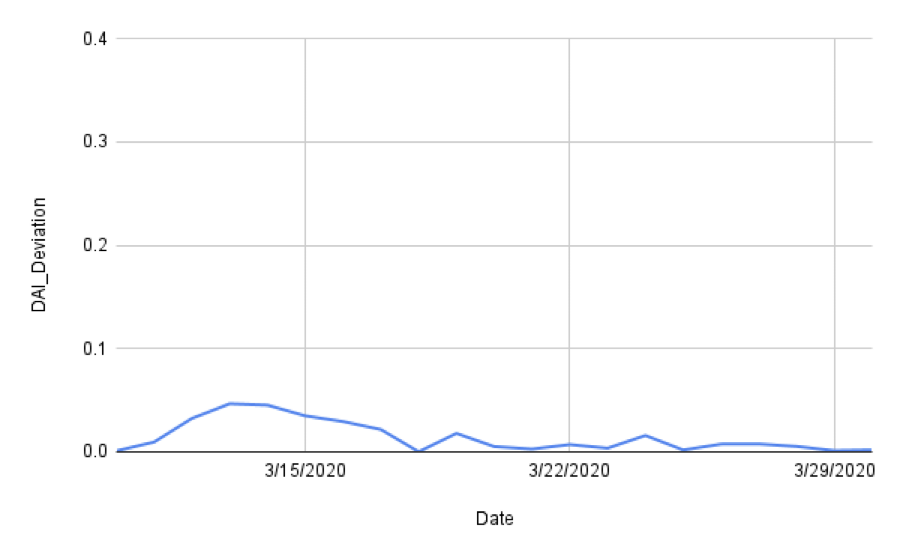
Figure 5. Ethereum Average Gas Price in March 2020
5. Conclusion
This paper analyzes the stability of leading stablecoins using a nonlinear machine learning model combined with a review of major depegging episodes. The results reveal a clear divide between fiat backed and crypto collateralized designs. Fiat backed stablecoins show muted and short lived deviations from their pegs during external shocks, reflecting liquid reserves, arbitrage and institutional support. In contrast, the crypto collateralized DAI moves more strongly with systemic risk, embedding mark to market leverage, on chain frictions and liquidation dynamics similar to run effects in traditional finance. Linking model based evidence to historical stress events validates and extends recent work on stablecoin fragility, showing that fiat backed coins behave like tightly managed exchange rate regimes, while crypto collateralized coins resemble leveraged intermediaries whose stability depends on collateral valuation, market infrastructure and the speed of on chain adjustments. Future research could integrate real time indicators of liquidity and collateral quality, examine the market microstructure of trading venues and bridges, and test policy or design interventions such as redemption limits or insurance funds to better assess stablecoin resilience under stress.
References
Briola, Riccardo, and coauthors. 2023. “Anatomy of a Stablecoin Run: Evidence from the Terra-Luna Collapse.” Finance Research Letters, 51: 1544–6123.
Corbet, Shaen, Brian Lucey, Larisa Yarovaya, et al. 2021. “Machine Learning in Cryptocurrency Markets: A Survey.” Finance Research Letters.
Diamond, Douglas W., and Philip H. Dybvig. 1983. “Bank Runs, Deposit Insurance, and Liquidity.” Journal of Political Economy, 91(3): 401–419.
Grobys, Klaus, et al. 2021. “Stablecoins and Systemic Risk: Nonlinear Dependence and Stress Episodes.” Finance Research Letters.
Klages-Mundt, Ariah, Dominik Harz, Lewis Gudgeon, Jun-You Liu, and Andreea Minca. 2020. “Stablecoins 2.0: Economic Foundations and Risk-based Models.” AFT ’20, 59–79. ACM.
Lyons, Richard K., and Ganesh Viswanath-Natraj. 2023. “What Keeps Stablecoins Stable?” Journal of International Money and Finance, 131: 102838.
Mallqui, Daniela C., and Ricardo A. Fernandes. 2019. “Predicting the Direction, Maximum, Minimum, and Close Values of Daily Bitcoin Price Using Machine Learning Techniques.” IEEE Access, 7: 148551–148563.
Shen, Dawei, et al. 2020. “Nonlinear and Deep Learning Approaches to Crypto Asset Volatility Forecasting.” Applied Soft Computing.
About the author

Abhiram Kode
Abhiram is a rising 11th-grade student at Rock Hill High School in Frisco, Texas, with strong academic and research interests at the intersection of finance, technology, and engineering. He is deeply passionate about investment banking, fintech, cryptocurrency markets, and applied robotics, and actively pursues opportunities that blend analytical thinking with real-world problem solving.
Beyond research, Abhiram tutors mathematics at Kumon, plays varsity tennis, and participates in competitive chess and speed cubing. He has earned multiple national and international awards in mathematics and science Olympiads. Known for his curiosity, discipline, and self-driven learning, Abhiram aspires to pursue a future career that combines finance, technology, and innovation.