
Author: Khrish Butani
Mentor: Dr. Tayyeb Shabbir
King George V School
I: Introduction
As the world grapples with a transition to renewable energy, solar energy has emerged as the leading contender in the journey toward a cleaner and sustainable future. While solar energy is seen as relatively environmentally friendly, the financial viability of solar energy remains a key factor in its widespread adoption and integration. This paper is going to explore the understudied area of the financial viability of solar renewable energy to further understand the financial and economic nuances of the complex and intricate field of solar energy.
To narrow the scope of my research and provide a detailed analysis on the topic at stake, I have decided to focus on the state of California as my region of focus. California is the USA’s leading state in the generation of solar energy, producing over 68,800 GWh of electricity in 2023, which is over double any other state’s output [1]. Additionally, California boasts a high average of 263-300+ sunny days per year, making solar energy a form of energy that can be easily harnessed. [2] . Not only this, but the average cost of a solar system in California ranks the cheapest out of all states at USD$20,363 before incentives [3]. As a result, California provides a prime example of how solar energy can be harnessed effectively and a suitable region for this case study.
With this information in mind, why is the topic of ‘The Financial Viability of Solar Energy In California’ important in today’s world and our future? As California leads the nation in solar energy adoption, understanding the intricate nature of the costs, payback period, and regulatory situation can help provide various stakeholders such as consumers, investors, and policymakers with detailed insights into the present-day situation and future growth of the solar sector. Ultimately, this study is essential to understand how solar energy can continue to be scaled upwards in California, and place further emphasis on the implementation of renewable technologies in our rapidly developing world.
To conduct this study, there are several key areas that need to be considered and analyzed. The next section will explore the historical background of solar energy production in California. Following this, section III will dive into the difference between solar photovoltaics and solar thermal. In section IV, an investigation into the status of solar energy in California will be conducted. In section V the federal and state regulatory framework for solar energy will be explored. After, section VI will contain an analysis of the financial viability of solar energy, including the customer side and the production and distribution side. Finally, in section VII, major findings will be highlighted, concluding remarks will be given, and future research opportunities will be noted.
II: Historical Background of Solar Energy Production in CA
The salient developments in the solar energy sector are noted below in a chronological order.
- In 1955, PV tech was born in the USA, with Bell Laboratories researchers creating a 6% efficient cell. [4]
- California solar energy industry formed 1970 with it predominantly being used by people who live in off-grid societies [5]
- U.S. Department of Energy was formed in 1977 [4]
- 1979, when ARCO Solar opened the world’s biggest solar photovoltaic facility in Camarillo [5]
- In 1985, researchers at Stanford University created 25%-efficient cells [4]
- In 1986, a solar thermal electric facility was commissioned in Kramer Junction, CA, which was the world’s largest solar thermal facility at the time. [4]
- In 2007, the California Solar Initiative was launched by the California Public Utilities Commission (CPUC) as part of the broader “Go Solar California” campaign. It was a USD $3.3 billion initiative funded by ratepayers aiming to install over 3000MW of solar capacity in the form of photovoltaic and thermal systems [4].
- In 2014, the Ivanpah Solar Electric Generating System opened in the Mojave Desert , becoming the world’s largest concentrated solar power (CSP) plant.
- In February 2016, the U.S. reached 1 million solar installations, driven by a dramatic decrease in solar prices [4]
- In the present (June 9 2025), across the USA, the current solar capacity is 248GW large, with a total of 278,447 jobs in the industry. [7]
III: Types of Solar Energy
Solar energy in California is generated in two forms, solar photovoltaic (PV) and solar thermal. This section will highlight the differences between the two.
III a. Solar Photovoltaic
Photovoltaics gets its name from the process of turning light (photons) energy from the sun into electricity (voltage) using solar cells made of semiconducting materials in a phenomenon called the photovoltaic effect [8]. When the energy from photons hits a semiconductor, it transfers its energy to electrons, allowing them to break free from their bonds and become free electrons. This free electron creates an electron-hole pair with the corresponding hole it leaves behind after it has been freed. The semiconductors in solar cells usually consist of a built-in electric field that separates the electron hole pairs, forcing the electrons to flow one way and the holes the other way. This electric field is created by the junction of p-type and n-type semiconductor materials. Electrodes are attached to both the p-type and n-type regions which allow the electrons to flow through an external circuit. This flow creates an electric current, which can be harnessed and utilized as electricity. After being harnessed as electricity by an appliance such as a lightbulb for example, the electrons recombine with their corresponding holes to complete the cycle that goes on indefinitely as long as there is sunlight hitting the solar cell [9]. This technology was first exploited in 1954 by scientists at Bell Laboratories who created a working solar cell that harnessed the sun’s light energy and transferred it to electrical energy.
So, what materials of semiconductors are typically used in PV systems? Silicon is the main material used as semiconductors in a solar cell, but there are two types: monocrystalline and polycrystalline. Monocrystalline silicon cells are made from a single continuous silicon crystal structure, which makes it more efficient than polycrystalline cells but more expensive as a result [9]. Their efficiency ranges from 16 to 24 % [10]. Polycrystalline silicon cells are made from multiple smaller interconnected silicon crystals which makes them less efficient but more affordable [9]. Their efficiency ranges 15% to 20% [11].
In California, solar PV panels are typically made of either monocrystalline silicon cells, or polycrystalline silicon cells. Approximately 97% of global silicon wafer production needed for solar cells occurs in China. They are then shipped from China and made into solar cells. About 75% of the silicon solar cell production occurs in Vietnam, Malaysia, and Thailand by Chinese subsidiaries [12].
III b. Solar Thermal
Solar thermal is a form of renewable energy in which sunlight is transferred and converted into thermal energy (heat) instead of directly into electricity like photovoltaics. [13]. In California, a technology called concentrated solar power (CSP) is used, which is a specific type of solar thermal technology that uses mirrors or receivers to concentrate large amounts of sunlight onto a small receiver. Inside the receiver is a heat-transfer fluid that is heated by the energy from the concentrated sunlight [14]. The thermal energy of this fluid is used to produce steam, which transfers the energy to mechanical energy through the turning of turbines, which power a generator to produce electricity [14].
In California, there are two main types of CSP technology that are used to generate electricity: Parabolic Troughs and Solar Power Towers. While both use mirrors to concentrate sunlight to generate electricity, there is a difference in the way these systems are set up.
Parabolic Trough systems are the most common type of CSP technology. They consist of long, parabolic shaped mirrors that reflect concentrated sunlight toward a tube that runs parallel across the mirrors’ center [16]. These trough shaped mirrors are aligned on a north-south horizontal axis, allowing the continuous tracking of the sun throughout the whole day from it rising in the east to setting in the west [14]. Inside the tube that runs along the mirrors’ center is the heat transfer fluid that is heated to produce steam, which turns turbines that generate electricity [16]. While the thermal efficiency when the transfer fluid is used to heat steam to drive a standard turbine generator ranges from 50% to 80%, the overall conversion efficiency from solar power to electrical output power is just 15% [15].
Solar Power Tower systems, on the other hand, feature numerous mirror reflectors at ground level, known as heliostats. These heliostats are computer controlled which allows them to continuously adjust and reflect sunlight toward a single point at the top of a tower where the receiver is situated for the entire day. Just like mentioned above, within the receiver is the heat transfer fluid —typically a molten salt— which is used to generate steam and turn turbines for electricity generation [16]. Real world applications claim that the peak efficiency for Solar Power Tower systems range from 20% to 35%, however, due to variations in weather conditions, in practice the net annual solar to electricity conversion rate ranges from 7% to 20% [17].
IV: Status of Solar Energy in CA
Currently, California is home to the three of the largest operational solar photovoltaic facilities in the USA: the 550MW Topaz Solar Farm, the 550 MW Desert Sunlight Solar Farm, and the 579 MW Solar Star facility [18]. It is also home to large CSP plants, such as the 392 MW Ivanpah Solar Power Facility, the 280 MW Genesis Solar Energy Project, and the 280 MW Mojave Solar Project [18].
IV a: Solar Facility Locations in California
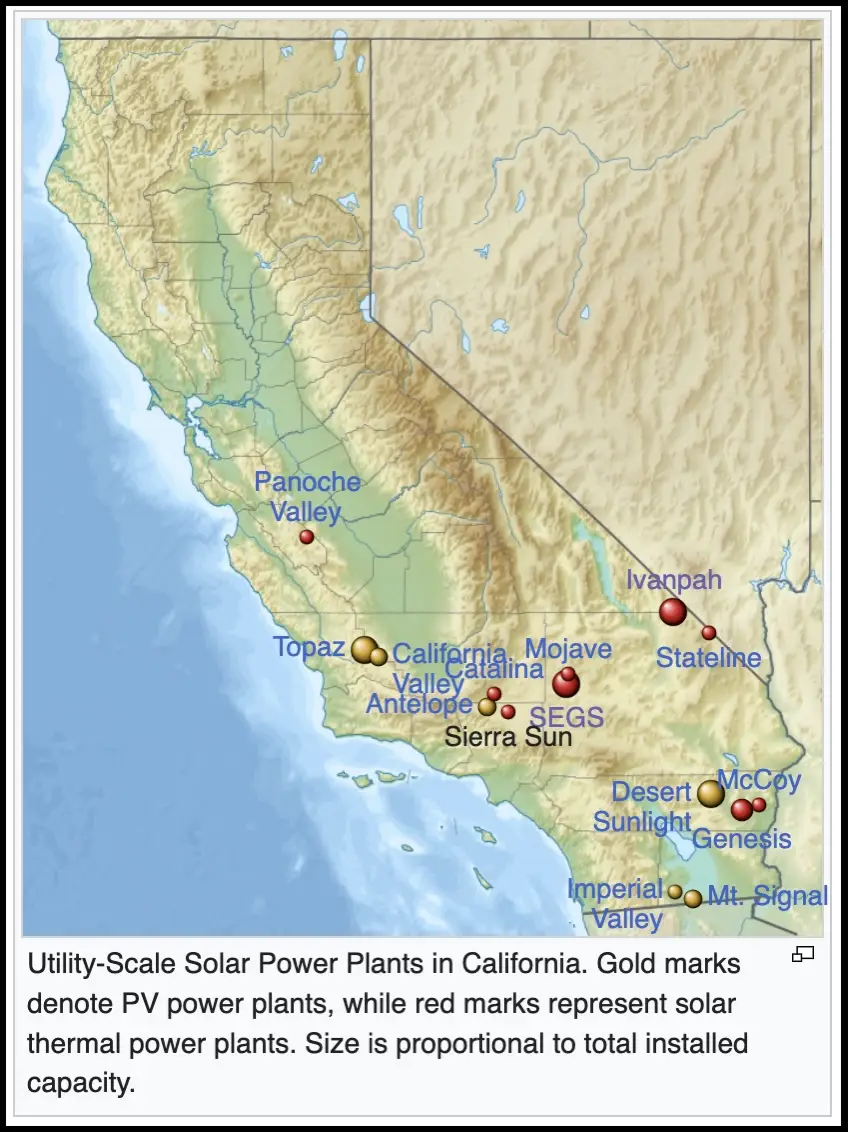
According to this map of utility scale solar farms in California, the regions in which there is a high density of solar farms and facilities can be seen. Three prominent locations are in Southern California and the Desert Regions. Southern California’s abundance of solar farms is a result of the cities of Los Angeles and San Diego being in this region. These regions favour solar farms highly with a large abundance of sunshine yearly, with LA boasting 263-290 sunny days per year [19] and San Diego boasting an average of 263 sunny days per year [19]. Meanwhile, the Desert Regions in California such as Mojave desert also host large solar farms such as SEGS stated above, as they have high solar irradiance and available land.
IV b: Solar Capacity of Different Sectors
Now that the locations of plants have been covered in California, we can dive into an exploration of the split of solar energy use between the state’s different sectors.
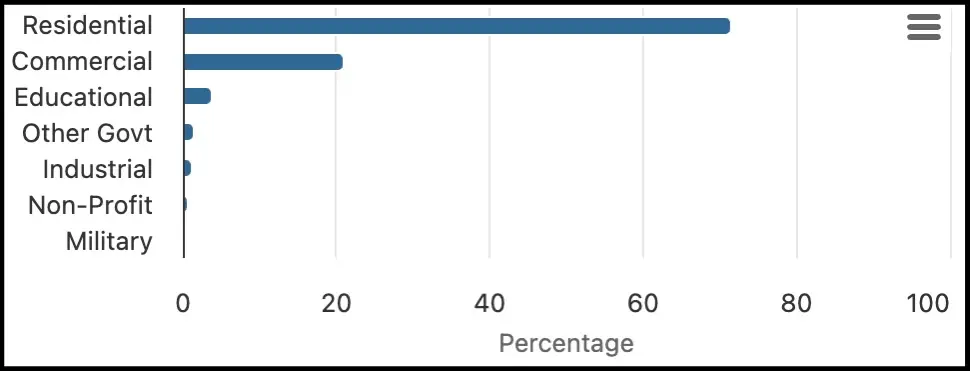
The chart above showcases the percentage capacity of solar power generation projects in California from August 1st, 2015, onwards. It was created by the California Distributed Generation Statistics (DGStats), which is the California Public Utilities Commission’s official public reporting site for solar power generation projects. According to the chart, 71.53% of solar capacity in California from August 1st, 2015, onwards is for the residential sector, 21.03% is for the commercial sector, 3.78% for the educational sector etc. Educational purposes in this context refer to schools that have installed solar capacity. In California, this number was 2,819 schools as of 2023 [21].
When this stat is viewed with information of California’s total solar capacity, which was 46,874 MW at the end of 2023 — enough to power 13.9 million homes [18] — it reiterates the widespread adoption of solar energy in California while simultaneously providing further information on how the solar energy capacity is split throughout the state.
V: Regulatory Policies regarding Solar Energy: Federal vs CA
This section will dive into an exploration of the regulatory framework around solar energy. It will consider federal policies, as well as state (CA) policies.
V a: Federal
The Trump Administration and Biden Administration have different views, policies, and actions toward the solar industry, as both parties possess different philosophies. Biden: supporting solar energy growth, Trump: not so much.
Pre-Biden, under the Obama Administration, solar electricity generation increased “30-fold and solar jobs grew 12 times faster than the rest of the economy”, according to the Whitehouse archives [22]. One notable initiative the Obama administration announced was the ‘Clean Energy Savings for All Initiative’. This targeted solar access and energy efficiency in low- and moderate-income communities, aiming for 1 GW of solar by 2020. [22]
Biden Administration
The Biden administration was very notably pro-solar energy.
Firstly, strong federal support for expanding solar projects across the country was given, particularly in California. An example of this was when the Bureau of Land Management approved solar projects in Riverside County, California. Combined, these projects would be enough to power approximately 132,000 homes [23].
Secondly, Biden’s Inflation Reduction Act included a $7 billion grant program called “Solar for All’ administered by the US Environmental Protection Agency (EPA). This program aimed to achieve solar installations for a staggering 900,000 low-income and disadvantaged households nationwide, with California’s share being equivalent of USD $250 million [24].
Lastly, the Biden Administration helped to strengthen an existing federal solar tax credit, which is formally called the Residential Clean Energy Credit. It was expected to expire in 2022, but the Inflation Reduction Act extended it to 2035. But what is a tax credit? A tax credit is a dollar-for-dollar amount taxpayers claim to reduce the income tax they owe. This credit offered 30% for any costs related to a solar system installation. Hence, essentially, the benefit to customers is that they receive 30% back for purchases related to installing solar panels and batteries in the form of a tax credit [25].
Trump Administration
The Trump Administration, on the other hand, acted essentially the opposite.
Firstly, the EPA, under Trump’s administration, moved to cancel the $7 billion ‘Solar for All’ program, including California’s $250 million share. This severely impacted solar projects for lower income households and in lower income communities [26].
Additionally, President Trump’s ‘Big Beautiful Bill’ will completely cut the residential federal solar tax credit by December 31st, 2025. Homeowners now have until this date to purchase and install solar systems in their residences or pay the full price in 2026. The residential solar tax credit is the only tax credit which is cut regarding solar energy (Section 25D of the U.S. Tax Code). Commercial solar projects and third-party owned systems use a different tax credit (Section 48E), so they still receive the 30% tax credit [27]. However, this is only available for systems that start construction by July 4, 2026, or are fully operational by the end of 2027 [27].
V b: State (CA)
California Solar Mandate
Perhaps the most significant mandate California has in place to promote the generation and use of solar energy is the California Solar Mandate. This is a building code that requires all new single- and multi-family homes that are up to three stories high to have a solar PV system installed as an energy source from 1st January 2020 onwards [28]. These laws were recently updated in 2025. Under the 2025 code, single-family homes, multifamily units, and specific nonresidential properties must include a rooftop solar PV system, and incorporate battery storage in certain areas [29]. This update aims to emphasize solar systems and reduce reliance on fossil fuels in California.
Solar System Property Tax Exemption
The Solar System Property Tax Exemption is California’s way of ensuring to customers that installing a solar power system in their living space will not raise their property taxes [30]. This form of incentive means that any increase in value to one’s living property because of solar energy system installations will not contribute to property tax when property tax assessments are carried out. The estimated value for this exemption is USD $240 per year, but it depends on the home price, installation, and local taxes [25].
Self-Generation Incentive Program (SGIP)
California’s Self-Generation Incentive Program (SGIP) offers rebates that can cover significant costs associated with solar energy system installation and use [30]. Specifically, the utility customers of four major investor-owned utility companies: San Diego Gas & Electric, SoCalGas, Southern California Edison and Pacific Gas & Electric, are eligible to receive these rebates [25]. The California Public Utilities Commission offers USD $150 rebate for each kilowatt-hour of solar storage system, with higher rebates ranging from USD $850 to USD $1000 for those who meet certain criteria regarding income and geographic location [25], for example areas with high fire risk, according to the Current Home blog [30].
Disadvantaged Communities Single-Family Solar Homes (DAC-SASH) Program
California’s Disadvantaged Communities Single-Family Solar Homes (DAC-SASH) program provides incentives for those who receive lower-incomes and live in disadvantaged communities [25]. Eligible customers can receive up to $3 per watt in incentives for solar installations which in many cases can cover the full cost of installation [30]. In total, this program offers Californians USD $8.5 million annually [25].
VI: Financial Viability of Solar Energy in California
This section will focus on the financial viability of solar energy in California. First, an exploration will be conducted into the customer decision making aspect of solar investments, followed by an analysis of the production and distribution side, including costs and comparisons with other forms of energy.
VI a: Customer Side
Now it is time to dive into the customer side of solar energy usage. For reference. commercial and residential solar energy panels are typically made of photovoltaic cells in California.
Benefits For Customers
Customers of solar panels, residential or commercial can use the electricity generated for their homes or office buildings, instead of electricity from the grid. Grid electricity prices rise 5.9% annually, so solar energy can save tens of thousands over the lifetime of their solar panels [31]. In San Francisco, a 5.7kW residential solar system can save $108,200 over 25 years [31].
Customers can also sell energy to the grid network of the area around them, which can generate a steady supply of revenue as shown in the business plan above. However, even if they use electricity for their own purposes, they can sell excess electricity generated back to the grid, and receive net metering benefits. In California, consumers can receive a rate of $0.08/kWh sent back to the grid [25].
To reiterate, residential and commercial customers also benefit from the 30% federal solar tax credit. However, the residential solar tax credit is being cut on January 1 2026, so to benefit, construction must start before that date. However, commercial solar projects and third-party owned systems use a different tax credit (Section 48E), so they still receive the 30% tax credit [27].
Solar Panels are relatively easy to maintain. Consumers can expect a cost of $150-$300 annually for professional cleaning and maintenance. Additionally, annual inspections are recommended to ensure the system has no serious issues, which can cost $150-$200 [32].
Additionally, solar systems can boost home value by 5-10%, according to EnergySage. In context, “for the average $790,000 California home, that’s an eye-popping $39,500 to $79,000 boost in resale value.” [33] This boost doesn’t affect property tax however, due to the California Solar System Property Tax Exemption.
Financing Options for Consumers
Cash Purchase: Buying in cash means consumers can benefit from all the savings that the solar system generates. Additionally, they do not have to pay loans or interest, but that means that there is a relatively higher initial investment cost. [34]
Solar Loans: These allow customers to borrow money to finance the installation of solar systems. They can be made through credit unions, banks, or specialized lenders. While there are no upfront costs and the system is fully owned by the consumer, interest rates must be paid. [34]
Solar Leasing and Purchasing Power Agreements (PPAs)
Leasing: This is paying a third party a set monthly rent for a solar system installation. [34]
Power Purchase Agreements (PPAs): Like leasing, but instead of a set rent for the solar installation, customers pay a set rate for the electricity generated. [34]
For both these options, installing and maintaining the system falls under the provider’s responsibility, and this option saves money on utility expenses. However, the system isn’t owned by the customer, meaning no personal savings can be generated, and no tax incentives or rebates can be enjoyed by the customer. [34]
VI b: Production and Distribution
Cost of PV systems
This section will go into the costs of a residential 5kW solar PV system (RPV), the cost of a 3MW commercial solar PV system (APV), and the cost of a 100MW utility scale solar PV system (UPV) according to the United States Department of Energy. The department of energy has calculated the levelized cost of energy (LCOE), which measures the lifetime costs of an energy system – including building the facility and operating it – divided by total energy production it is expected to produce over its lifetime. This metric is commonly used to compare the cost effectiveness of different forms of energy generation which will occur later in the paper. [35]
It is important to note that these figures represent a national average before the 30% federal tax credits have been accounted for, rather than local prices in California. The department of energy explains that “LCOE is lower than the value listed in these tables in locations with more annual sunshine (up to 30% less in the desert southwest, which includes southern California), and higher in regions with less annual sunshine (up to 30% more in the Pacific northwest, which includes parts of northern California).” [35] Hence, we can calculate the extremes of the LCOE of each scale of solar PV system in different parts of California, albeit before tax credits.
| Type | PV System Size | LCOE |
| UPV | 100 MW | $47/MWh |
| APV | 3MW | $75/MWh |
| RPV | 8kW | $142/MWh |
Table 1: 2024 Q1 PV Cost and LCOE. Source: U.S. Department of Energy [35]
As the figure above from the department of energy shows, the LCOE for UPV systems is $47/MWh, while for APV systems and RPV systems it is $75/MWh and $142/MWh respectively. $/MWh means the cost of producing one megawatt hour of electricity using solar energy. The table below showcases the adjusted LCOE values for southern regions of California and the LCOE for the northern regions of California as well. [35]
| TYPE | PV System Size | LCOE | LCOE in Southern Regions (30% less) | LCOE in Northern Regions (30% more) |
| UPV | 100MWdc | $47/MWh | $32.9/MWh | $61.1/MWh |
| APV | 3MWdc | $75/MWh | $52.5/MWh | $97.5/MWh |
| RPV | 8kWdc | $142/MWh | $99.4/MWh | $184.6/MWh |
Table 2: 2024 Q1 PV LCOE California Regions. Source: U.S. Department of Energy [35], and Author’s Calculations
The respective LCOEs were calculated by multiplying the LCOE by 0.7 for southern California, and 1.3 for northern California.
In summary, the LCOE for UPV systems in California ranges from $32.9/MWh to $61.1/MWh, $52.5/MWh to $97.5/MWh for an APV system, and $99.4/MWh to $184.6/MWh for an RPV system.
Cost of Solar Thermal systems
Solar Thermal systems are only used to generate electricity on a utility scale in California. The cost of a utility-scale solar thermal system in California typically ranges widely depending on the specific technology, scale, and design. There are no published average figures by the department of energy on solar thermal plants, so instead we can dive into the LCOEs of the Ivanpah Solar Power Plant and the Mojave Solar Project.
The NREL – which is the U.S. The Department of Energy’s primary national laboratory for energy systems – has published the LCOEs of the Ivanpah Solar Power Plant and the Mojave Solar Project. The LCOEs of these plants are $190 per MWh and $240 per MWh respectively as of 2020. [36] [37].
LCOE of other forms of energy
The US Energy Information Administration (EIA) published a report titled “Levelized Costs of New Generation Resources in the Annual Energy Outlook 2022” in March 2022, which included national averages of LCOE estimates by 2027 in 2021 USD. All figures are in 2021USD$ per MWh. The LCOE of four of the most frequent energy sources in California: Wind, Hydroelectric, Nuclear, and Natural Gas will be determined. In California because of stringent environmental restrictions, complex licensing, additional fees, higher fuel and operational costs, and higher labor, the LCOEs will be higher than national average, with the maximum LCOE determined from the report [38].
| ENERGY TYPE | National Minimum LCOE (2021$/MWh) | Simple Average LCOE (2021$/MWh) | National Maximum LCOE (2021$/MWh) | California LCOE Range (2021$/MWh) |
| Wind, onshore | 30.01 | 40.23 | 65.65 | 40.23 – 65.65 |
| Wind, offshore | 109.88 | 136.51 | 170.31 | 136.51 – 170.31 |
| Wind, offshore with tax credits | 86.34 | 105.38 | 128.93 | 105.38 – 128.93 |
| Hydroelectric | 48.96 | 64.27 | 82.65 | 64.27 – 82.65 |
| Nuclear | 82.76 | 88.24 | 98.78 | 88.24 – 98.78 |
| Nuclear with tax credits | 76.23 | 81.71 | 92.25 | 81.71 – 92.25 |
| Natural Gas | 34.30 | 39.94 | 39.94 | 39.94 – 50.09 |
Table 3: LCOE of Alternative Energy Sources to Solar. Source: US Energy Information Administration [38]
Comparisons Between Energy Forms
It is important to note that all the findings above are for utility scale projects, and they are estimates for the year 2027. Hence, it is only justified to compare the UPV and utility scale solar thermal projects LCOEs with the above figures. Also, it is important to note that over time, the LCOEs tend to decrease. This is due to technological advancements, economies of scale, and reduced financing costs. Hence, this must be kept in consideration when comparing LCOEs.
In order to compare figures, we need to convert our UPV LCOE and solar thermal LCOE to 2021 USD per MWh. This can be done using a CPI inflation rate calculator [39]. The table below showcases the results.
| ENERGY TYPE | California LCOE Range (2021$/MWh) |
| Solar UPV system | 28.87 – 53.62 |
| Solar Thermal Ivanpah Solar Power Plant | 194.98 |
| Solar Thermal Mojave Solar Project | 246.29 |
Table 4: LCOE Utility Solar in 2021 USD $/MWh
They can now be viewed in a table with all the other energy forms from lowest to highest LCOE.
| ENERGY TYPE | California LCOE Range (2021$/MWh) |
| Solar UPV system | 28.87 – 53.62 |
| Natural Gas | 39.94 – 50.09 |
| Wind, onshore | 40.23 – 65.65 |
| Hydroelectric | 64.27 – 82.65 |
| Nuclear with tax credits | 81.71 – 92.25 |
| Wind, offshore with tax credits | 105.38 – 128.93 |
| Solar Thermal Ivanpah Solar Power Plant | 194.98 |
| Solar Thermal Mojave Solar Project | 246.29 |
Table 5: LCOE of Energy Sources in Ascending Order in 2021 USD $/MWh
We can see that solar PV systems have the lowest LCOE in California, but the solar thermal projects in California have the highest LCOE. This can be misleading because the LCOEs calculated are of systems of different capacity, and the solar thermal plants taken into consideration are the largest in California, and up to five times in capacity the size of UPVs considered. In reality, global solar thermal LCOEs are at around $100/MWh [40]. In addition to this, the LCOEs for solar PV and thermal do not reflect any system-level subsidies, while the other forms of energy’s LCOEs do. Nonetheless, the table above provides a strong indication that solar PV has the relatively lowest cost to operate over its lifespan, and an indication that solar energy in California is relatively inexpensive as compared to other renewable energy sources for utility scale electricity generation.
VI c: Example: Business Plan for a 3MW Solar Farm in California
Introduction
This project is a commercial-scale solar farm, 3MW in size, located in the outskirts near San Diego in Southern California. The energy generated is intended to be sold to utility companies in the region through a PPA. The aim is for the PPA to provide a steady source of revenue for the farm so costs such as the bank loan, land lease costs, insurance costs, and operations and maintenance (O&M) costs can be paid off.
Possible Project Owner Description
This business plan can be for an investor with large amounts of idle capital, or a limited liability corporation with idle equity, as the bank loan used only finances 75% of the solar system cost, not to be mistaken with the entire project cost.
Technology
The project uses polycrystalline solar PV cells which are considered less efficient than monocrystalline cells but will cause reductions in cost. Their efficiency ranges 15% to 20% [11].
Market Analysis
The market for solar energy in California is large, with solar energy providing over 30% of the state’s electricity as of 2024 [41]. As touched upon in an earlier section, while the residential sector leads in solar capacity, California’s commercial sector still has a large portion of capacity at 21.03% [20]
The target market for the solar farm’s energy output is utility firms who finance our project with a PPA. Examples of large utility companies in South California are Southern California Edison (SCE) and Pacific Gas and Electric Company (PG&E). These firms, alongside many other large utility companies, are all known to have given out countless PPAs in the past, giving this project an extra layer of feasibility.
Management Team
The management team consists of one solar technician, one solar operator, and 1 security officer.
The solar operator will handle the daily operation and maintenance of a solar energy system, while the solar technician handles the installation, troubleshooting, and repair of solar equipment. The security officer guards the farm at night to prevent break-in.
Financial Plan
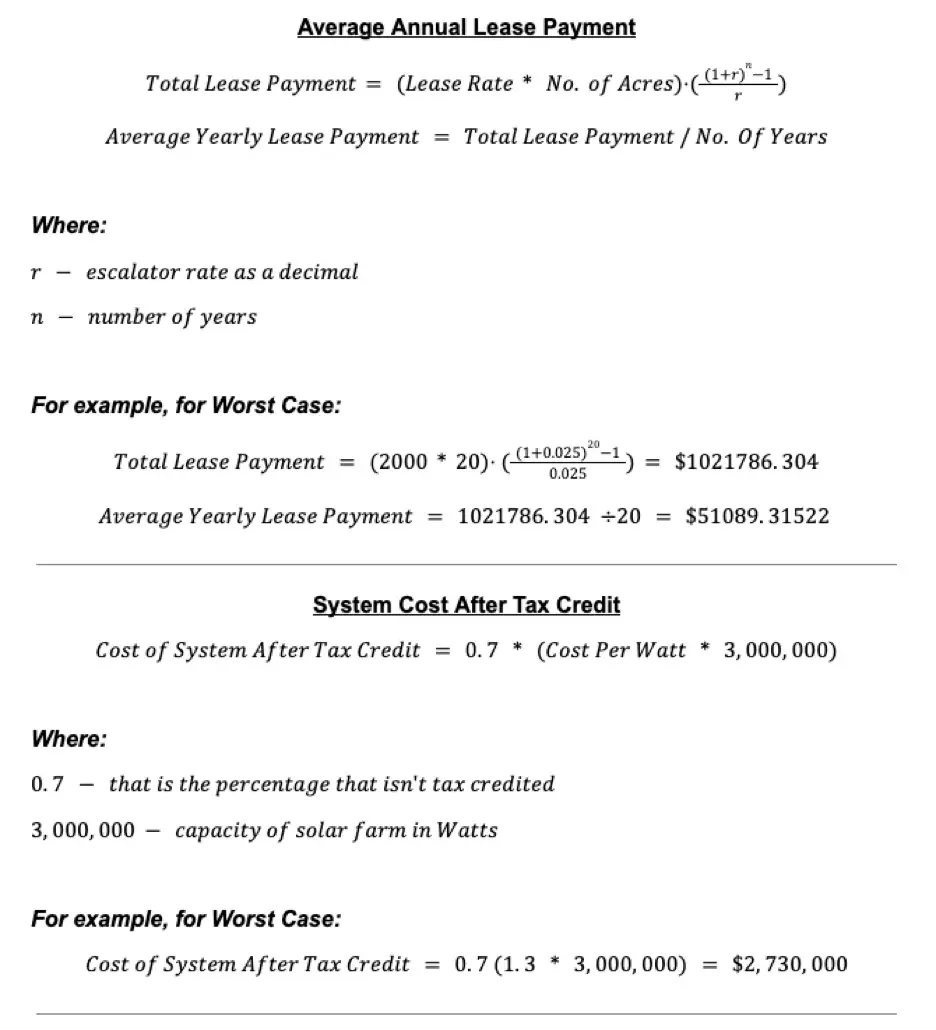
For this project, a worst, realistic, and best-case scenario will be explored, with a simple payback period calculated as well for each. The specifications for each case will be showcased in the table below.
| Worst Case | Realistic Case | Best Case | |
| Land Lease Rate [42] | $2000 per acre per year with escalator rate of 2.5% | $1500 per acre per year with escalator rate of 2% | 1000 per acre per year with escalator rate of 1.5% |
| Cost of System Per Watt [43] | $1.3 | $1.1 | $0.9 |
| Operations and Maintenance Costs per kW per year [35] | $24.2 (10% more than realistic case) | $22 | $19.8 (10% less than realistic case) |
| Capacity Factor [44][45] | 25% | 29% | 33% |
| MWh per year | 6570 MWh | 7621.2 MWh | 8672.4 MWh |
| 10 year bank loan Interest Rate [46] | 7.5% | 6% | 4.5% |
| Annual Insurance Costs [47] | $8,190 | $5,313 | $2,835 per year |
| Annual PPA Revenue Rate [48] | $50.922/MWh (10% less than realistic case) | $56.58/MWh | $62.238/MWh (10% more than realistic case) |
Table 6: Cases for 3MW solar Farm
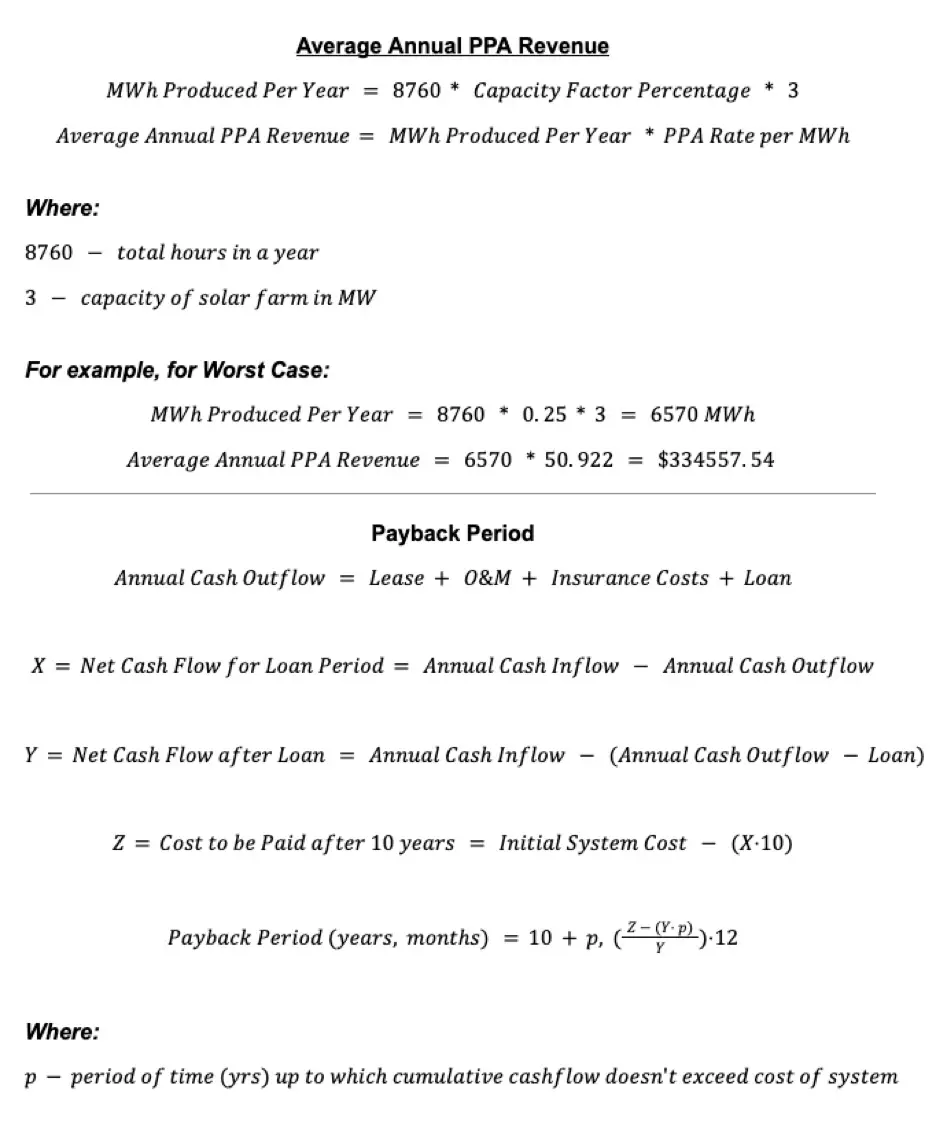
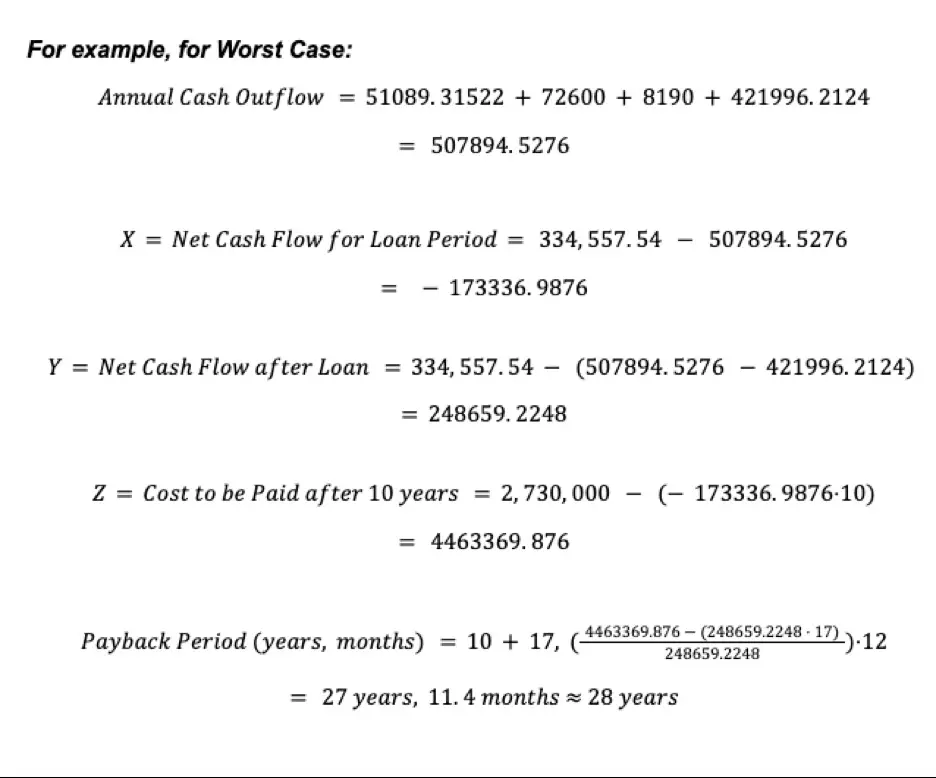
Using these figures the Payback Period could be calculated:
| Worst Case | Realistic Case | Best Case | |
| Payback Period | 28 years | 16 years 9 months | 8 years 1 month |
Table 7: Payback Period of Each Case
Ultimately, the payback period of these 3 cases proves to be quite extensive. However, it is important to note that each case had 8 varying factors (e.g. lease rates, system costs etc.), with the worst case taking the worst figures of each of these factors, and vice versa for the best case. These extremities are unlikely to occur. There could be varying factors, such as a good lease rate, but a poor insurance rate, and that can influence the payback periods to different degrees. Therefore, there is scope for future research to be done into calculating the payback period and comparing cases if only one factor changed (e.g. interest rates).
The calculations for this case study are shown in Appendix A to this paper.
VII: Major findings, concluding remarks and future research
VII a: Major Findings & Concluding Remarks
This paper provided three major pieces of information summarized below, following which they will be discussed in more detail.
- A comprehensive analysis into the historical background leading up to present day, of the solar sector in California
- Comparisons of the LCOEs between solar energy and other forms of energy
- Example Business Plan for a 3MW solar farm in California
But altogether, what did these analyses conclude?
Firstly, solar energy in California remains relatively financially viable considering its low LCOE. However, the structure and future trajectory of solar energy in California can be majorly impacted by the public subsidies landscape, which impacts different stakeholders.
As seen above, utility scale solar PV has the lowest LCOE among major sources of energy, outperforming wind, hydroelectric power, nuclear and natural gas. While large utility scale solar thermal plants have a high LCOE, when the global average LCOE for solar thermal systems is compared to the other forms of energy, and considering the federal tax credit system, the LCOE seems much more competitive.
For consumers, the federal solar tax credit alongside California specific rebates and incentives (e.g. SGIP or DAC-SASH) reduce the upfront and long-term costs of solar. However, Trump’s “Big Beautiful Bill” aims to cut the 30% tax credit for residential solar systems, which can impact consumers who have lesser incomes. Despite this, the California specific incentives will continue to persist, which can mitigate the effects of this cut in incentives, and ensure that the decrease in solar popularity isn’t maximized.
Furthermore, solar installation firms are extremely profitable in California. One notable mention is Sunrun Solar (founded in 2007). From Q1 2024 to Q1 2025, Sunrun Solar’s revenue was USD $2.083 billion [49], and their gross profit was USD $394 million [50]. Initially, because of the federal tax credit cuts, solar firms may take a slight hit due to a possible decrease in residential solar installations. However, because there was no tax credit cut on residential solar that was leased from solar firms, solar firms can benefit as there may be an influx of customers willing to purchase their services.
The government benefits the most in the short-term future of solar energy in California, as the tax credit cuts mean that there may be an increase in tax revenue. However, these cuts may result in significant job losses in the solar sector. Unemployment results in lower income taxes and may result in the government handing out more welfare benefits.
Despite these considerations, solar projects still have the landscape to thrive in California, considering that California grid electricity prices rise every year by 5.9% [51]. Through the business plan, it is showcased that in a well thought out scenario (best case) with favoring interest rates and lease rates, a solar farm can be highly profitable. However, the future rate of solar adoption, particularly residential solar, remains more sensitive to how the policy changes influence the affordability of solar technology, especially the tax credit cuts.
Ultimately, whether solar energy in California is financially viable depends on whether solar energy can maintain a low LCOE and cost effectiveness in the ever-changing political and subsidy landscape. Some people may have the perspective that solar energy is financially viable due to low costs and sunny weather, while others may think that solar energy may not be financially viable in the long run due to changes in the regulatory landscape. In the end, maintaining a thriving future economic landscape for solar energy rests upon balancing these factors to ensure accessible, cost-effective, and scalable solar adoption across the state.
VII b: Future Research
Future research can tie into advancements in solar PV cell technology, how the efficiencies of solar energy affect its viability, and calculating the payback period and return on investment with an increasing variety of the factors stated above.
- Solar PV Technology:
Recent advancements have been made into increasing the efficiency of solar PV cells. Examples of these are perovskite solar cells or tandem solar cells. These cells have pushed the efficiency of solar PV cells to above 30% [52]. This, coupled with California’s vibrant sunny weather, with a high average of 263-300+ sunny days per year, allows for maximizing solar exposure, which can improve energy output and efficiency. It would be interesting to find out how this affects the financial viability of solar panels in California, if at all.
- How Efficiency Influences Financial Viability
By studying the efficiency of solar cells whether PV or thermal and comparing them with efficiencies of other forms of energy, we can dive into another lens through which we can determine whether solar energy is viable in California. This can be analyzed to determine how much the overall viability of solar energy in California depends on the financial versus the efficiency side.
- Payback Period and Return on Investment Calculations
Above, this paper had dove into the payback period of a 3MW solar farm in California using proforma calculations. However, the calculations entailed a large variety of varying factors, all of which play a different magnitude of a role in the final payback period calculation. A study that considers more ‘What If?’ scenarios and calculation simulations can be carried out to better grasp an in depth understanding of the financial status of solar energy in California.
- Subsidy and Regulatory Policy for the Future
Above, the current situation regarding subsidies and regulatory policies were explored and analysed. However, an interesting avenue of research could be to model the expected growth of the California solar sector in relation to the subsidy and regulatory policy landscape. Two main points to research here could be the predicted growth rate across President Trump’s term, and the possible political tug of war between federal and state policies.
References
- Olano, M. V. (2024, April 12). Chart: Which US states generate the most solar and wind energy? Canary Media. https://www.canarymedia.com/articles/clean-energy/chart-which-us-states-generate-the-most-solar-and-wind-energy
- Discover the sunniest cities in California. (2025, June 23). Our Guide to SLO CAL and Beyond. https://www.slocal.com/blog/post/discover-the-sunniest-cities-in-california/
- Walker, E., & Aggarwal, V. (2025, July 31). Solar panel cost in 2025: It may be lower than you think. EnergySage. https://www.energysage.com/local-data/solar-panel-cost/
- Solar achievements timeline. (n.d.). Energy.gov. https://www.energy.gov/eere/solar/solar-achievements-timeline
- Koski, A. (2024, November 6). California solar Industry [Facts you might not know]. Current Home. https://www.currenthome.com/blog/california-solar-industry-facts-you-might-not-know/
- California Solar Initiative. (n.d.). https://www.cpuc.ca.gov/-/media/cpuc-website/files/legacyfiles/j/4215-jan09.pdf
- SEIA. (2025, June 26). Solar Market Insight Report – SEIA. https://seia.org/research-resources/us-solar-market-insight/
- Solar Photovoltaic Technology Basics | NREL (n.d.). https://www.nrel.gov/research/re-photovoltaics
- Solarnplus. (2024, June 25). How PV cells harness the sun to generate electricity. Solar N Plus. https://www.solarnplus.com/how-pv-cells-harness-the-sun-to-generate-electricity/
- Xipeng et al. Monocrystalline Silicon Cell – an overview | ScienceDirect Topics. (n.d.). https://www.sciencedirect.com/topics/engineering/monocrystalline-silicon-cell
- How efficient are polysilicon solar cells? – BLOG – Tongwei Co., Ltd.,. (n.d.). https://en.tongwei.cn/blog/8.html
- U.S. Department of Energy. (2022). Solar Photovoltaics Supply Chain Deep Dive assessment. https://www.energy.gov/sites/default/files/2022-02/Solar%20Energy%20Supply%20Chain%20Report%20-%20Final.pdf
- Solar thermal energy: what it is and its benefits. (2024, May 22). REPSOL. https://www.repsol.com/en/energy-and-the-future/future-of-the-world/solar-thermal-energy/index.cshtml
- Solarnplus. (2024, November 26). What is Concentrated Solar Power? Solar N Plus. https://www.solarnplus.com/what-is-concentrated-solar-power/
- Wikipedia contributors. (2024, August 3). Parabolic trough. Wikipedia. https://en.wikipedia.org/wiki/Parabolic_trough
- Thoubboron, K. (2024, February 28). Concentrated Solar Power (CSP): What you need to know. EnergySage. https://www.energysage.com/about-clean-energy/solar/contentrated-solar-power-overview/
- Wikipedia contributors. (2025, July 20). Concentrated solar power. Wikipedia. https://en.wikipedia.org/wiki/Concentrated_solar_power
- Wikipedia contributors. (2025, August 1). Solar power in California. Wikipedia. https://en.wikipedia.org/wiki/Solar_power_in_California
- Annual Days of Sunshine in California – Current results. (n.d.-a). https://www.currentresults.com/Weather/California/annual-days-of-sunshine.php
- Statistics and Charts. (n.d.). CaliforniaDGStats. https://www.californiadgstats.ca.gov/charts/nem/
- Which states have the most Solar-Powered schools? (2023, February 15). GovTech. https://www.govtech.com/education/k-12/which-states-have-the-most-solar-powered-schools
- FACT SHEET: Obama Administration Announces Clean Energy Savings for. (2016, July 19). whitehouse.gov. https://obamawhitehouse.archives.gov/the-press-office/2016/07/19/fact-sheet-obama-administration-announces-clean-energy-savings-all
- Biden administration approves expansion of solar power on U.S. land. (2021, December 21). PBS News. https://www.pbs.org/newshour/nation/biden-administration-approves-expansion-of-solar-power-on-u-s-land
- Biden-Harris administration announces $7 billion solar for all grants to deliver residential solar, saving Low-Income Americans $350 million annually and advancing environmental justice across America | US EPA. (2024, April 22). US EPA. https://www.epa.gov/newsreleases/biden-harris-administration-announces-7-billion-solar-all-grants-deliver-residential
- Butler, P. (2025, April 25). California Solar panel incentives: tax credits, rebates, financing and more. CNET. https://www.cnet.com/home/solar/california-solar-panel-incentives-tax-credits-rebates-financing-and-more/
- EHN Curators. (2025, August 7). California stalls on community solar as Trump moves to pull federal funds. EHN. https://www.ehn.org/california-stalls-on-community-solar-as-trump-moves-to-pull-federal-funds
- Walker, E. (2025, July 24). President Trump Signs Bill Killing The solar Tax Credit—Here’s What it Means for Homeowners. EnergySage. https://www.energysage.com/news/congress-passes-bill-ending-residential-solar-tax-credit/
- Thoubboron, K. (2023, February 27). California Solar mandate: What you need to know. EnergySage. https://www.energysage.com/blog/an-overview-of-the-california-solar-mandate/
- New Day Solar (2025, April 16). Understanding California’s solar mandates for new builds in 2025. New Day Solar. https://www.newdaysolar.com/understanding-californias-solar-mandates-for-new-builds-in-2025/
- Koski, A. (2024, November 29). California Solar incentives, tax credits, rebates, and financing options for 2025. Current Home. https://www.currenthome.com/blog/california-solar-incentives-tax-credits-and-rebates-2025/
- Solar vs Grid Power: Cost Comparison for SF Homeowners. (n.d.). Earthwise Energy Solutions | Local Solar Power Installers. https://earthwiseenergy.com/solar-vs-grid-power-cost-comparison-for-sf-homeowners/
- Richard, & Richard. (2025, February 27). The real cost of solar panels: from purchase to payoff (And everything between). Residential Solar Panels. https://www.residentialsolarpanels.org/financial-aspects/cost-analysis-assessment/the-real-cost-of-solar-panels-from-purchase-to-payoff-and-everything-between/
- Langone, A., & Walker, E. (2025, August 4). New study: Solar panels can add up to $79K to your home’s value. EnergySage. https://www.energysage.com/news/solar-power-as-a-home-improvement-strategy/
- Sun Solar Electric. (n.d.). Everything you need to know about solar financing. Sun Solar Electric. https://www.sunsolarelectric.org/blog/207-everything-you-need-to-know-about-solar-financing
- Solar Photovoltaic System cost benchmarks. (n.d). Energy.gov. https://www.energy.gov/eere/solar/solar-photovoltaic-system-cost-benchmarks
- Ivanpah Solar Electric Generating System | Concentrating Solar Power Projects | NREL. (2022, October 21). https://solarpaces.nrel.gov/project/ivanpah-solar-electric-generating-system
- Mojave Solar Project | Concentrating Solar Power Projects | NREL. (2023, October 25). https://solarpaces.nrel.gov/project/mojave-solar-project
- U.S. Energy Information Administration. (2022). Levelized costs of new generation resources in the Annual Energy Outlook 2022. In U.S. Energy Information Administration. https://www.eia.gov/outlooks/aeo/pdf/electricity_generation.pdf
- Inflation calculator. (n.d.). https://www.calculator.net/inflation-calculator.html
- Khan et al. (2024). The economics of concentrating solar power (CSP): Assessing cost competitiveness and deployment potential. Renewable and Sustainable Energy Reviews, 200, 114551. https://www.sciencedirect.com/science/article/abs/pii/S1364032124002740
- SEIA. (2024, October 2). A new reality: the path forward for California’s solar and storage industry – SEIA. https://seia.org/blog/new-reality-path-forward-californias-solar-and-storage-industry/
- Richardson, M. (2025, July 31). Solar farm land lease rates: Average rent per acre. US Light Energy. https://uslightenergy.com/solar-land-lease-rates-how-much-do-solar-companies-pay-to-lease-land/
- Farmer, T. (2023, November 14). How much does a solar farm cost? HomeGuide. https://homeguide.com/costs/solar-farm-cost
- Southwestern states have better solar resources and higher solar PV capacity factors – U.S. Energy Information Administration (EIA). (n.d.). https://www.eia.gov/todayinenergy/detail.php?id=39832
- Bohrium | AI for Science with Global Scientists. (n.d.). https://www.bohrium.com/paper-details/capacity-factors-of-solar-photovoltaic-energy-facilities-in-california-annual-mean-and-variability/812585412068376577-31943
- VCIB. (2025, August 6). VCIB Commercial Solar Equipment Loans. https://vancitycommunityinvestmentbank.ca/commercial-lending/clean-energy-financing/solar-financing/
- Agopian, A. (2024, May 20). For Solar Developers – Solar Property Insurance is Priced. Solar Insure. https://www.solarinsure.com/for-solar-developers-how-solar-property-insurance-is-priced
- Penrod, E. (2024, October 22). Renewable PPA prices continue to rise — and may do so through 2030, say LevelTen, Ascend analysts. Utility Dive. https://www.utilitydive.com/news/ppa-power-purchase-prices-wind-solar-levelten-ascend-analytics/730245/
- Sunrun Revenue 2014-2025 | RUN. (2025). Macrotrends.net. https://macrotrends.net/stocks/charts/RUN/sunrun/revenue
- Sunrun Gross Profit 2014-2025 | RUN. (2025). Macrotrends.net. https://macrotrends.net/stocks/charts/RUN/sunrun/gross-profit
- Sunlux. (2025, January 14). Solar Power vs. Rising Cost of Electricity in California – Sunlux. Sunlux. https://sunlux.com/blog/solar-power-vs-rising-cost-of-electricity-in-california/
- Rayzon Solar. (2025, May 21). Latest advancements in solar PV module technology (2025). Rayzon Solar. https://rayzonsolar.com/blog/solar-pv-module-innovations-2025
Appendix A: Business Plan
Using Proforma data, these calculations were carried out above in Section VI c, “Example: Business Plan for a 3MW Solar Farm in California”.
Acknowledgements
I would like to acknowledge and thank Dr Tayyeb Shabbir – Professor of Finance & Economics, California State University Dominguez Hills and former faculty member, Wharton School, University of Pennsylvania Philadelphia, PA – for mentoring me as I conducted research on this topic.
About the author
Khrish Butani
Khrish is a senior at King George V School. His interest for finance, business, economics, and regions with successful solar sectors were what pushed him to pursue this research project. Outside of the classroom, Khrish is an avid cricketer, representing Hong Kong at Under 16 and Under 19 level. At collegiate level, he hopes to continue researching different industries across the globe in which the financials are sometimes overlooked.