

Author: Meghana Chittineni
Mentor: Zachary Michaelson
DRS International School
Abstract
This paper finds evidence that trade imbalances, in either direction, correlate to income inequality within the nations involved in trade. This evidence supports the thesis that global imbalances also result in domestic imbalances and that there are no clear winners and losers to trade imbalances, at least at the national level.
Key Words: International Trade, Income Inequality, Trade Surplus, Trade Deficit
Introduction
The cross-national sale of resources, finished goods, and services to consumers interconnects almost everybody in the world. Global trade has become essential since it allows us to purchase low-priced products from abroad, resources to cut costs, and products that are not domestically available. This means that production or economic activity within one country affects the economies of its trading partners. The emergence of free trade further simplifies the accessibility of internationally produced products. It allows various countries to expand their markets, reduce production costs, provide domestic and international customers with variety at low cost, and utilize specialized skillsets to increase productivity and sales.
Opportunities from free trade may reduce the income disparity between countries since the average income of developing nations rapidly increases. The opposite may happen for income disparity within nations (income inequality), which has been progressively worsening around the world. Around 71 per cent of the worldwide population lives in countries where inequality has risen (United Nations, 2022). The NAFTA agreement of 1994 is an example of a trade agreement which caused rich households’ incomes in the US to nearly double from 1.3 percent to 2.3 percent within six years while poor/marginal households saw no substantial increase in their incomes.
The availability of low-cost labour internationally reduces the opportunities in the domestic economies of higher income nations since firms seek low-cost labour abroad to reduce production costs and maximize profits. This means that free trade forces domestic workers to compete against workers from countries with low labour costs forcing them to choose between low wages or unemployment. For example, Gourdon et al (2008) found that trade liberalization, measured by decreases in tariff revenue, is associated with increases in income inequality, especially in poor countries where the share of the labour force with little education is high. The evidence suggests that income inequality is exacerbated for lower income workers in the nations on both ends of international trade. Meanwhile, highly-skilled and higher income labour benefit from free trade since they can reduce production costs and their skillset is domestically irreplaceable. This increases their income and therefore likely increases their political influence.
Income inequality has adverse effects on societies. The affordability and access to essential services such as education and healthcare can reduce, causing standards of living for the poor to fall. This is seen in form of higher infant mortality rate and female mortality rates in the lower-income groups. Moreover, there is also a correlation between the extent of income inequality and the crime rates, especially among the poor, across various countries (Fajnzylber et al, 2001).
The World Inequality Report states that the richest people, who make up 10% of the population, earn about 52 per cent of the total income. In contrast, the poorest earn only 8 per cent. On average, that is $122,100 versus $3,920 (Chancel et al, 2022).
The thesis of this paper is that trade imbalances, in either direction, result in increased income inequality within the nations involved. This may occur because the wealthy in one country are unable to spend their income domestically and therefore end up importing capital goods (investments) and consequently forcing the country into exporting goods and services (a current account surplus). At the other end, their trading partner may be cornered into producing more debt (to export as capital goods) than they would otherwise generate, and meanwhile under-producing goods and services. The workers who would be producing these goods and services therefore suffer and income inequality widens in the current account deficit country.
We take a new approach to exploring these relationships by measuring correlations between income inequality and trade balances and find defence for our thesis. We use a dataset from the World Bank Development Indicators collection.
Methods
For income inequality we use the Gini index. For trade imbalances, we use current account balance. The World Bank Development Indicators dataset includes data from 1960 to 2020. To prevent anomalies and errors in future calculations, we omitted countries with minimal to no data and ensured that this remained constant in both matrices.
Results
For the data overall, there is a highly significant negative relationship between current account balance and Gini coefficient (t = -6.35, p < 3e-10). That is, globally, nations with a current account deficit are more likely to suffer from greater income inequality domestically. However, these results may conceal what happens at the other end of the spectrum to countries with high current account surpluses. Therefore we looked at individual country statistics, as well. Table 1 provides the most significant country level results for countries with trade deficits. These results confirm that trade deficits are generally associated with higher income inequality.
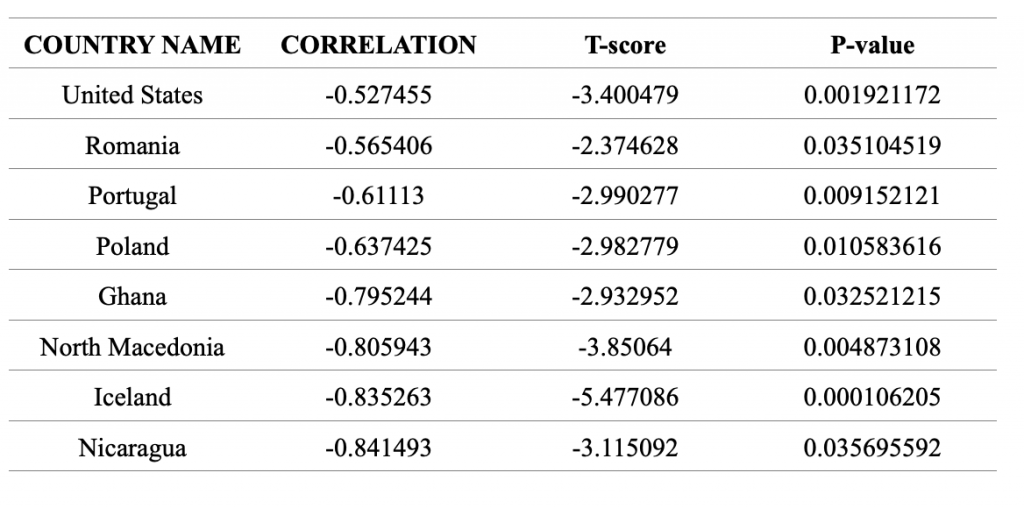
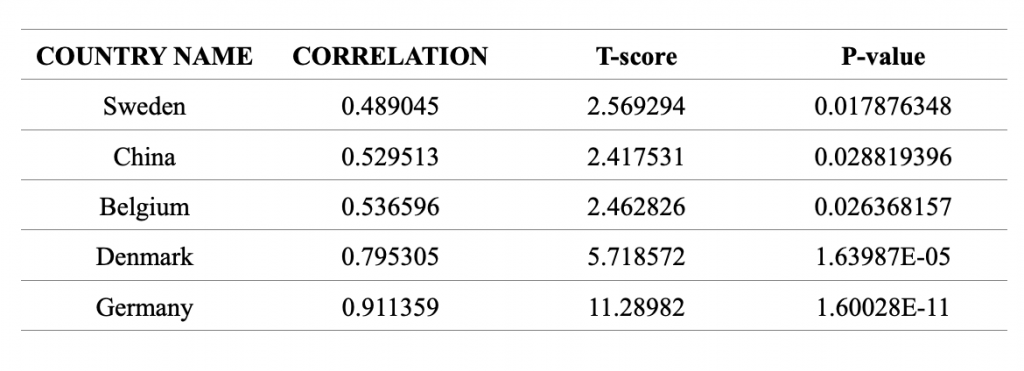
Table 2, however, provides the results for countries that have the highest current account surpluses. Indeed, the opposite effect is found. Many of the countries with the highest current account surpluses have highly significant positive relationships between their current account balance and their Gini coefficients. In this case, these countries develop worsening domestic inequality as their current account balance increases. Essentially, this means that trade imbalance both ways can increase income inequality within a country.
Discussion
A trade surplus occurs when a country’s exports exceed its imports. Simply put, a country sells more than it buys. In theory, countries that export more seek to reduce their production costs. They can achieve this by either reducing the wages or outsourcing their operations. However, this can have adverse effects since lower wages reduce the affordability of workers, causing the gap between the rich and the poor to increase. Outsourcing labour means that there will be reduced employment in the domestic country, which again leads to reduced income and affordability.
An example is Germany, which has experienced a trade surplus for over a decade. However, their households have decreased spending due to loss of income, primarily to the government sector. The German government resorted to tight fiscal policies, among other measures, to keep their trade surpluses high. This led to greater inequality (seen in the 0.911 correlation of trade imbalance to income inequality), the highest of any nation in the dataset.
One result from Table 2 that was unexpected is China. China is known worldwide as a country that manufactures and exports. In line with that, China’s trade surplus of 97.94 billion USD in June 2022 from 50.14 billion USD in the same month a year earlier bet the market forecasts for surplus of 75.7 billion USD. Moreover, China also has a Gini coefficient of 0.47, marking the income inequality in the country relatively high. Hence, China’s situation, paired with its weak correlation between both factors, brings us to an interesting question of why China’s income inequality, despite China being an export rich country, is not based on its trade imbalance. This mismatch could be due to lack of data from China or other influencing factors of income inequality beyond the scope of the dataset used for this paper.
A trade deficit occurs when a country’s imports exceed its exports. Countries that spend more than they earn fall behind on their budget, which pushes them to either let foreign bodies invest in their assets or borrow from other countries or international funding bodies. When these debts increase, they start pressuring the currency of the country. Moreover, deficits can also hurt the employment opportunities in the country since low exporting means that domestic goods sell less abroad. More importing also means that domestic goods are consumed less even within the country, further reducing job opportunities. However, it is also important to note that a trade deficit doesn’t necessarily mean low economic growth. Prime examples of this would be the United States, which has a trade deficit but a high functioning economy and Germany, which has a trade surplus but low economic growth.
Among the countries with a relatively strong negative correlation in Table 3, Iceland stands at -0.835. It also has a T-score of -5.47, showing the differences within the data set, and a p-value of 0.000106205, which confirms that the relationship obtained is not on chance. This country is an interesting example of the relationship between the two factors since Iceland has a Gini coefficient of 26.1, making it among the top 10 countries with the lowest income inequality. Similarly, Iceland’s trade deficit makes up 6.83% of its GDP, which is lower than a few of its past years. Hence, Iceland’s data shows us how the decrease in trade deficit leads to lower income inequality, making it a unique example in the dataset.
In table 1, the United States has a trade deficit but has a weak negative correlation with income inequality. Its trade balance makes up a relatively small part of its GDP, unlike China, and the Gini coefficient for the United States is 0.485, which is relatively high. These facts, when compared to the weak negative correlation (0.527) for the United States, can be explained since income inequality in a developed economy like the USA with a high GDP can be heavily influenced by various factors. However, a correlation, despite trade not being an essential part of the US economy, helps support the hypothesis of the relationship between income inequality and trade imbalances. The p-value of 0.0019 further supports this since a low score indicates the lack of chance of occurrence.
Conclusion
The main conclusion of this paper is that there is a relationship between income inequality and trade imbalance in either direction, that is that this holds for both trade surplus and trade deficits. For trade deficits, there are cases where low inequality is supplemented by a decreasing trade deficit, like Iceland, going closer to trade balancing. An increase in trade deficit can also lead to increased income inequality. Similarly, trade surpluses can cause income inequality differently since exporting reduces domestic opportunities and consumption. A positive correlation can occur when both income inequality and trade deficit are high, like in Germany, or low at a time.
However, during the course of the research, we also stumbled upon interesting cases. Trade seemed to be a relatively insignificant factor in some countries and did not make up a significant part of their GDPs, like in the United States. In cases like these, income inequality can be high based on factors within the country, either qualitative or quantitative, which we did not consider in this research. In trade surpluses, China surprisingly was an example where a high trade surplus still led to weak correlation due to other factors influencing the country’s income inequality.
The main objective of this paper has been to explore the relationship between income inequality and trade imbalances through empirical data analysis. Hence, the contribution of this paper is majorly empirical. Therefore, this paper has a few shortcomings, which we hope can become further points to study. First, we did not include qualitative data into our research process. We relied on a statistical analysis of a dataset. Moreover, we did not take into account factors such as low trade significance and other internal factors. Lastly, there was a data shortage in the dataset for a few countries and components. Hence, we could not include them in the calculations.
References
Barusman, A. F., & Barusman, Y. S. (2017). The Impact of International Trade on Income Inequality in the United States since 1970’s. EUROPEAN RESEARCH STUDIES JOURNAL, 20(4A), 35–50. https://www.um.edu.mt/library/oar//handle/123456789/32489
Behringer, J., Treeck, T., & Truger, A. (2021, March 9). Germany must reduce its current-account surplus. Social Europe. https://socialeurope.eu/germany-must-reduce-its-current-account-surplus
Cerdeiro, D., & Komaromi, A. (2017, March). The effect of trade on income and inequality: A cross-sectional approach. International Monetary Fund. https://www.imf.org/~/media/Files/Publications/CR/2017/cr1766-ap-2.ashx
Chancel, L., Piketty, T., Saez, E., & Zucman, G. (2022). World Inequality Report 2022.
World Inequality Lab. https://wir2022.wid.world/
Country Economy. (2022). Iceland – Trade balance 2021. Countryeconomy.Com. https://countryeconomy.com/trade/balance/iceland
Dabla-Norris, E., Kochhar, K., Suphaphiphat, N., Ricka, F., & Tsounta, E. (2015, June). Causes and Consequences of Income Inequality: A Global Perspective. International
Monetary Fund. https://www.imf.org/external/pubs/ft/sdn/2015/sdn1513.pdf
Fajnzylber, P., Lederman, D., & Loayza, N. (2001). Inequality and Violent Crime. The Journal of Law and Economics. https://web.worldbank.org/archive/website01241/WEB/IMAGES/INEQUALI.PDF
Fernando, J., Boyle, M. J., & Rathburn, P. (2022, June 23). Gross Domestic Product (GDP).
Investopedia. https://www.investopedia.com/terms/g/gdp.asp
Gaille, B. (2019, June 3). 25 Trade Surplus Pros and Cons. BrandonGaille.Com. https://brandongaille.com/25-trade-surplus-pros-and-cons/
Gourdon, J., Maystre, N., & de Melo, J. (2008). Openness, Inequality and Poverty: Endowments Matter. Journal of International Trade and Economic Development, 17(3), 343–378. https://doi.org/10.2139/ssrn.1313756
Glen, S. (2022, April 18). T Test (Student’s T-Test): Definition and Examples. Statistics How To. https://www.statisticshowto.com/probability-and-statistics/t-test/
Hayes, A., Boyle, M. J., & Ma, J. (2022, April 12). Pros and Cons of a Trade Deficit. Investopedia. https://www.investopedia.com/articles/investing/051515/pros-cons-trade-deficit.asp
Hui, M. (2021, November 29). Will China be as unequal as the US is by 2025? Quartz. https://qz.com/2095489/will-china-be-as-unequal-as-the-us-is-by-2025/#:%7E:text=China’s%20current%20Gini%20coefficient%20is,the%20People’s%20Ban k%20of%20China.
The World Bank. (2010–2022, June 4–July 1). World Development Indicators (Version 13) [The World Development Indicators (WDI) is the primary World Bank collection of development indicators, compiled from officially-recognized international sources. It presents the most current and accurate global development data available, and includes national, regional and global estimates.]. World Bank Group. https://datacatalog.worldbank.org/search/dataset/0037712
TRADING ECONOMICS. (2022). China Balance of Trade – June 2022 Data – 1981–2021 Historical – July Forecast. https://tradingeconomics.com/china/balance-of-trade
United Nations. Inequality – Bridging the Divide. Retrieved June 16, 2022, from https://www.un.org/en/un75/inequality-bridging-divide
About the author
Meghana Chittineni
Meghana is the Head Girl of DRS International School, as part of the graduating class of 2023. She is an avid debater who has been part of various MUN conferences and has taken part in Financial competitions. She prides herself on being a professional Bharatanatyam dancer (Indian classical art form), mentor and student of other Indian classical art forms. She is a merit scholarship student and is passionate about contributing to society.