

Author: Jason Mok
Mentor: Dr. Gerald Friedland
Colts Neck High School
Abstract
This study aimed to determine the efficacy of funding structures on schools and to discover potential holes or inefficiencies. A Python simulation was created using New York’s Fair Student Funding (FSF) formula as a base. The FSF formula designates funds based on categories that students fit under, which include poverty, English Language Learner status, special needs, academic intervention, and specialized/advanced classes. A random percentage of the simulated school population was designated to each category and a budget was created. Schools with a large population of students who performed below average would receive disproportionately more funding than schools with students who performed above average. Funding from special needs students was also a significant factor. This shows that there could be some imbalances in school funding formulas which lead to over/underfunding.
Keywords: schools, funding, Fair Student Funding, New York, simulation
Introduction
A year or so back, I went to a school called Toms River East High School for a volleyball game. I remember vividly one of the antennas on the net breaking during the play. The players and coaches joked and laughed about it, saying that they were poor so they couldn’t replace it. But as the saying goes, “there’s a grain of truth in every joke.” How was it possible that Toms River, one of the biggest school districts in the state, did not have enough funds to replace an antenna on a volleyball net? And as I looked deeper into the issue, I realized that many school districts across the country had gripes with budgets and funding, mine included. This research project has to do with the potentially harmful effects that existing funding structures have on school districts.
The policy in question is the Fair Student Funding formula. The formula was first introduced in 2007 and has since accounted for “approximately two-thirds of a school’s total annual budget” (Touré 2018), applicable to a majority of New York’s public schools. Before the FSF was implemented, NYC’s school funds were allocated based on a series of funding formulas largely based on teacher salaries and the number of teachers a school had. This created an imbalance with high-performing schools, as these schools tended to attract more teachers and thus received more funding. FSF changed this by instead allocating funds based on the number and types of students at each school. Schools would now receive funding based on students per grade level and additional funding for students who fell into one of the categories, which include low-income households, those who struggle academically, those who are English language learners, those with a disability, and those who attend designated high schools. A number of other studies have been done on Fair Student Funding,
The goal of Fair Student Funding was to lessen the gap in funding between high-performing schools and the rest, and it did its job. In fact, it seems that the roles flipped entirely. Now, schools with a population of academically successful students receive less funding than schools with a population of students who struggle academically. This begs the question, is it really fair? While I understand that the previous way of doing things wasn’t appropriate either, two wrongs don’t make a right. Fair implies that every student gets the same thing, which is evidently not the case.
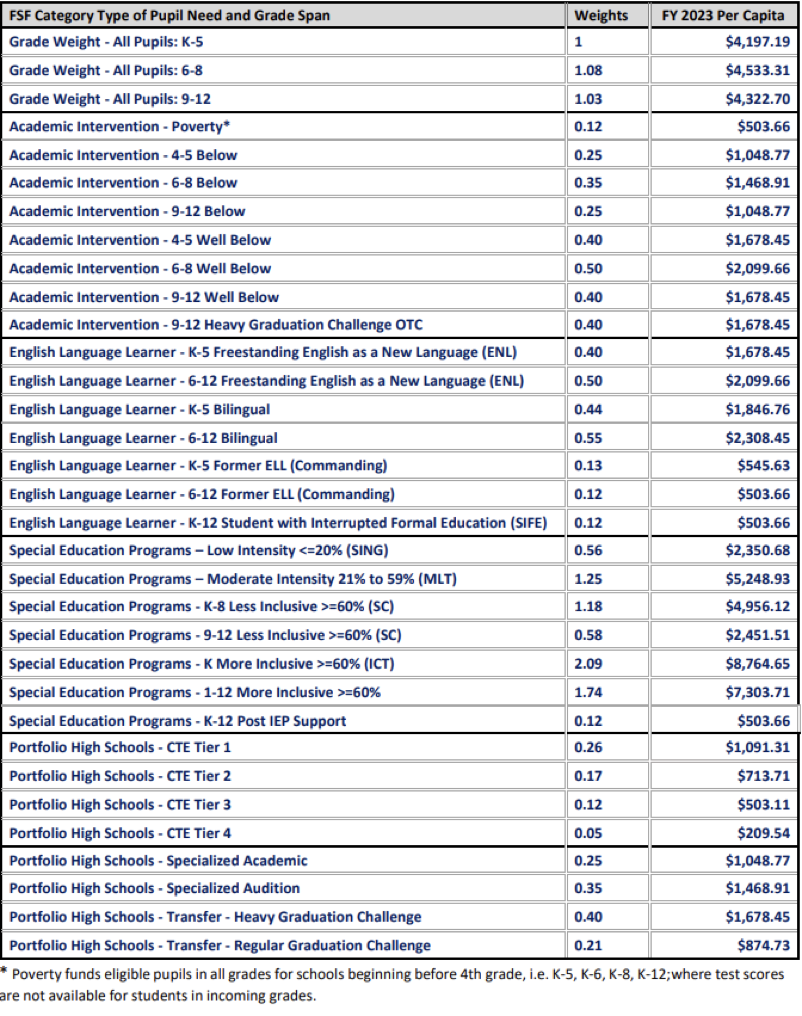
First, I took a look into the inner workings of the FSF formula; fortunately, FSF is well documented. Each category had subcategories for specific cases. I was able to find the “weights” of each category and how they valued them with respect to other categories. The basis was “grade weight K-5”, which had a weight of 1 and was valued at $4,197.19. Grade weights were the highest, followed by special education, academic intervention, English language learner (ELL), specialized academic, and career and technical education (CTE). After that, I took the sum of the monetary values associated with each subcategory and used that as the base factor for simulating the final budget. “High schools” were created with 1000 students each, and a randomized percentage of the student population would be designated to each category. The number of students in that category would then be multiplied by the respective base factor for that category, The resulting number would be the amount of money that that school would receive for students in that category.
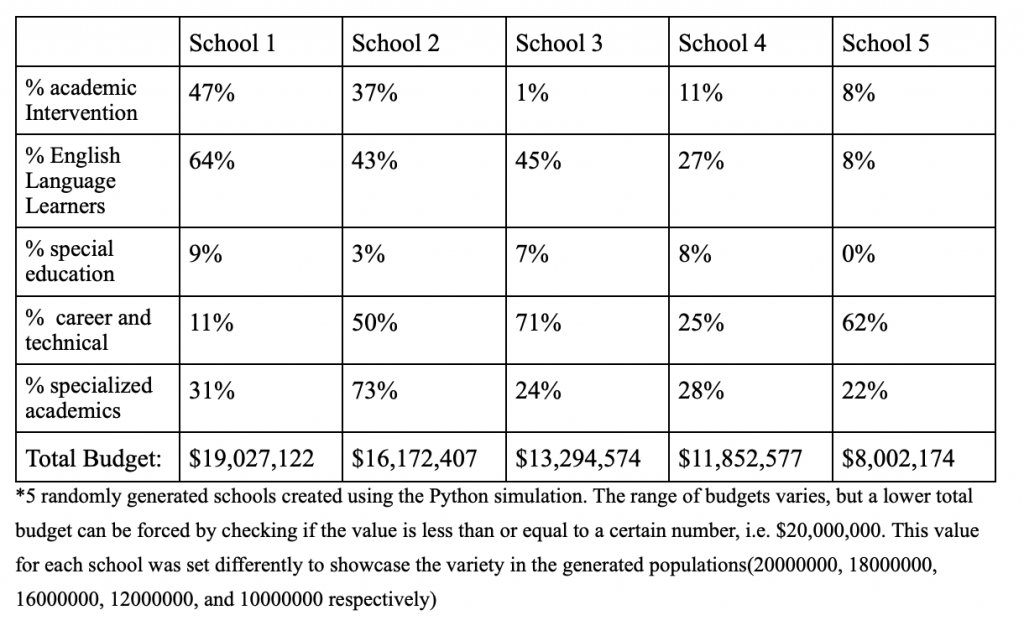
One example school generated a population of 8% academic intervention, 8% ELL, 0% special needs, 62% CTE, and 22% specialized academic. A school with this population would have received $8,002,174. By simply switching the percentages for academic intervention and CTE, the number jumps to $12,081,296. This confirms that schools with a large population of students who performed below average would receive disproportionately more funding than schools with the same amount of students but perform above average or take specialized courses for academics. It’s important to note that if a school had such a population distribution, the number would not be exactly the same, as there are other factors such as teacher salary among other things that can make a difference in the final budget number. FSF is also only a part of the whole. As stated before, FSF accounts for approximately two-thirds of a school’s funding.
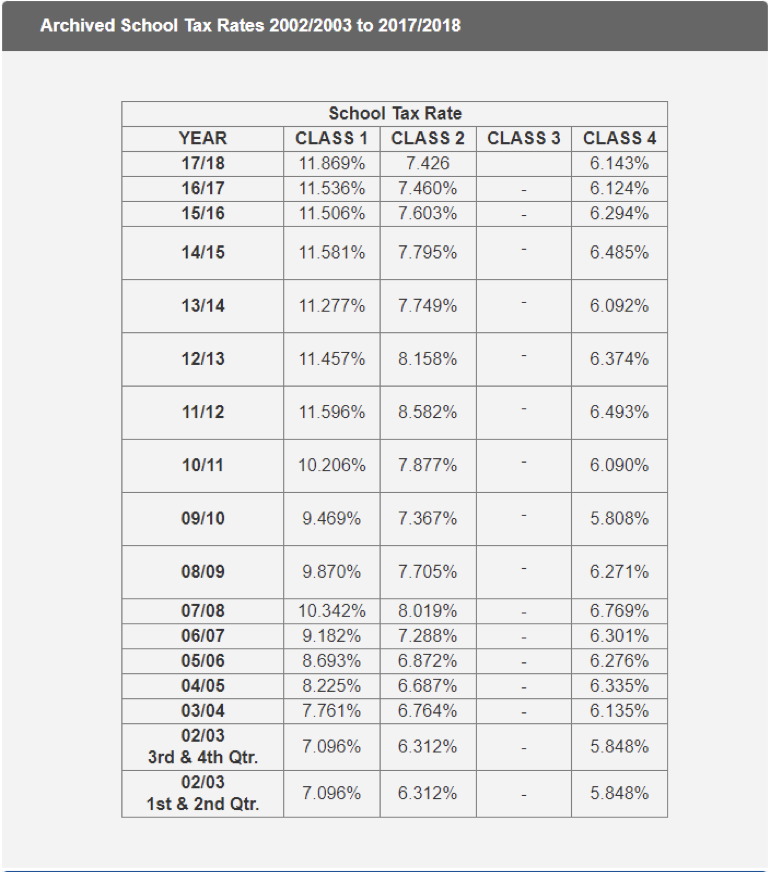
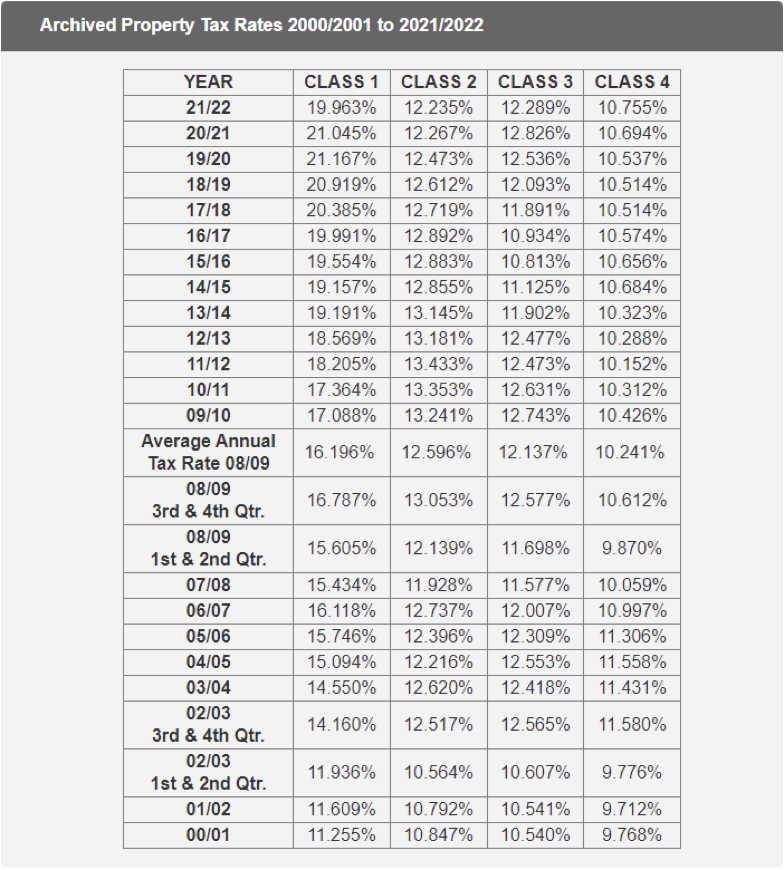
When school budgets rise, so too do taxes. The money must come from somewhere, and that’s out of the taxpayers’ pockets; more specifically, the middle class. Property Class 1 is defined as “most residential property of up to three units (family homes and small stores or offices with one or two apartments attached)” (Nyc.gov 2019), while Classes 2, 3, and 4 are for larger rental buildings and commercial and industrial property. In the year 2006, before FSF was introduced, the school tax rate for Class 1 was 9.182%. However, in 2007, the rate jumped to 10.342%. The trend continued and reached nearly 12% for FY 2017 and 2018. Additionally, the property tax rate had risen above 21% in FY 2020/2021 from 15% in 2006. However, this trend only affected Class 1. While Class 2 did see a small increase of 0.4%, the school tax rates didn’t deviate from the 7-8% range. Class 4 stayed within a percentage point from 6% entirely.
While marketed with good intentions, it’s clear that the Fair Student Funding formula has had the opposite effect. FSF creates the illusion of “fair” funding, but it’s a wolf in sheep’s clothing. It creates an unfair, imbalanced school district by catering to schools with students who don’t perform well while punishing schools with high-achieving student populations; at the same time, middle-class families are forced to pay ever-rising tax rates. Fair Student Funding doesn’t solve the funding issue that New York has, yet it has been in place for over a decade. That means that districts around the country that have similar funding structures also suffer from the same issues and side effects. Schools shouldn’t be punished for having a population of high-achieving students. There needs to be a solution where both high-achieving students are rewarded for their performance and low-achieving students are given an environment where they can succeed like their peers. Currently, Fair Student Funding doesn’t achieve that.
Acknowledgment
I would like to thank my mentor, Dr. Gerald Friedland, for his continued guidance throughout the research process. I would also like to thank my parents and my mentorship group for setting me up and supporting me from the backlines.
References
“2014-2015 School Budget Overview.” New York, 2020.
Banks, David C. “Fair Student Funding & School Budget Resources Guide FY 2023.” New York, New York City, June 2022. “Definitions of Property Assessment Terms.” Nyc.gov, 2019, www1.nyc.gov/site/finance/taxes/definitions-of-property-assessment-terms.page.
Jason Mok, school-funding-simulation, (2022), GitHub Repository, https://github.com/jasonmokkk/school-funding-simulation
“New York City to Spend an Average of $17.5K per Student This School Year.” POLITICO, www.politico.com/states/new-york/albany/story/2018/08/31/new-york-city-to-spend-an-average-of-17-500-per-student-this-school-year589344#:~:text=Facebook-,New%20York%20City%20to%20spend%20an%20average%20of,per %20student%20this%20school%20year&text=The%20city%20is%20planning%20to,to%20funding%20data%20released%20Friday.
“Property Tax Rates.” Www1.Nyc.gov, www1.nyc.gov/site/finance/taxes/property-tax-rates.page.
About the author
Jason Mok
Jason is currently a senior at the Colts Neck High School. He plays volleyball for his school and also plays piano in his free time. Jason has always been interested in computer science and programming, and recently started looking into data science.