
Author: Anjali Ramakrishnan
Mentor: Mark Fisher
The Episcopal Academy
Abstract
A cancer diagnosis is considered most beneficial to patients when identified in the early stages. Specifically in cases of cancer recurrence, treatment is most proactive before such can redevelop and overwhelm the patient’s bodily health. Consequently, medical professionals for numerous years have sought methods of targeting early-onset cancers, such as breast cancer, specifically with new technologies that analyze cell properties. Cellular differences between cancerous cells and normal cells have proven to be noticeable under microscopic examination. Focusing on the recognition of circulating cancer cells (CTCs), which pinpoint cancer recurrence following the shedding of previous tumor cells, allows doctors to initiate early treatment.1 Therefore the utilization of technologies that deal with cell isolation and analysis has frequented clinical trials in recent years. This includes the use of flow cytometry devices that carry out cell isolation, and individual evaluation based on light scatter at a point of interrogation.2 The wide variety of fluorescent dyes to stain such cells, as well as filters to measure when performing data analysis with the photomultiplier tubes that gather the light scatter, offer a unique approach to cell examination.3 However, identifying issues in the current application of flow cytometry such as CTC rarity and device efficiency must be addressed. Nonetheless, the solution posed by this device amends to be a needed alternative for blood sample testing due to the concentration solutions and cost evaluation of implementing flow cytometry throughout the medical field.
According to the Centers for Disease Control and Prevention (CDC), breast cancer inflicts death in approximately 42,000 women every year in the United States.4 Continually, 7-11% of women who undergo early onset breast cancer inevitably experience a recurrence within five years following their treatment.5 The severity of both invasive and noninvasive breast cancers proves detrimental to societal health on a large scale, and therefore outlining ways to identify recurrences while they are reasonably easy to treat remains important within the medical community. Despite the invention of numerous technologies that deal with tumor or mass identification, in more recent years, doctors have turned towards cell imaging to locate cancer cells. Through individual isolation and virtual imaging of circulating cancer cells (CTCs) from the bloodstream, medical experts can locate cancer recurrences far earlier than before. Specifically, flow cytometry offers a technological advancement to rapid analysis of individual cells as they pass through an interrogation point where the reflected light of laser beams offers information regarding their size, shape, and internal structures.6 Catering this technology towards the recognition of CTCs, through an understanding of the abnormalities of a cancer cell in contrast with a normal cell, will allow doctors to perform the minuscule task of cell examination with increased efficiency.7 While flow cytometry machines have been invented their adaptation into the medical world proves delayed, as mainly applied to laboratory methods and clinical trials, their halt of large-scale application reduces doctors’ ability to pinpoint early breast cancer recurrence.
CTC Rarity Within the Bloodstream
Before addressing the utilization of flow cytometry, the foundations for CTC discovery and rarity within the bloodstream must be established. CTCs are tumor cells that have shed from a primary carcinoma into the bloodstream and normally contribute to the growth of a new malignancy often at a different bodily site.8 Finding an individual CTC within the bloodstream demonstrates cancerous activity and therefore pinpoints a recurrence. However, the FDA has recognized CTC presence as crucial to an extent and therefore doesn’t quantify such breast cancer patients as CTC+ unless more than 5 CTCs are found within 7.5 mL of their blood.9 Although, a potential issue to wide-scale use of flow cytometry to assess blood samples for CTCs remains their rarity within the body and a consequential threat to the efficiency and practicality of this technology. Flow cytometry becomes useless if the blood needed to identify a singular CTC is far too vast an amount to withdraw from a patient. However, drawing too little poses futile as doctors would not be sure if there was rather no recurrence or simply no CTC within the sample they possessed. According to accessible research, there is approximately one CTC per 106-7 normal cells (1-10 million cells).10 Furthermore, a cubic millimeter of blood has 4-6 million cells.11 Traditionally blood samples for donation or even research purposes are taken as pints, which equate to 463,176 cubic millimeters. Therefore while doctors can hope that the pint of blood withdrawn, containing 1852704-2779056 (approximately 1.8 million- 2.7 million cells) million cells, that there is a singular CTC, using flow cytometry to identify such would be inefficient and unreliable. Furthermore, if doctors couldn’t determine the presence of one CTC such does not necessarily mean that the patient has not experienced a cancer recurrence but perhaps that the blood sample was not large enough, and there weren’t enough cells analyzed. CTC rarity illustrates a barrier in the large-scale application of flow cytometry in cancer recognition. Consequently, it must be assessed and addressed through the lens of increasing their concentration within the bloodstream.
Differences Between Cancerous & Normal Cells
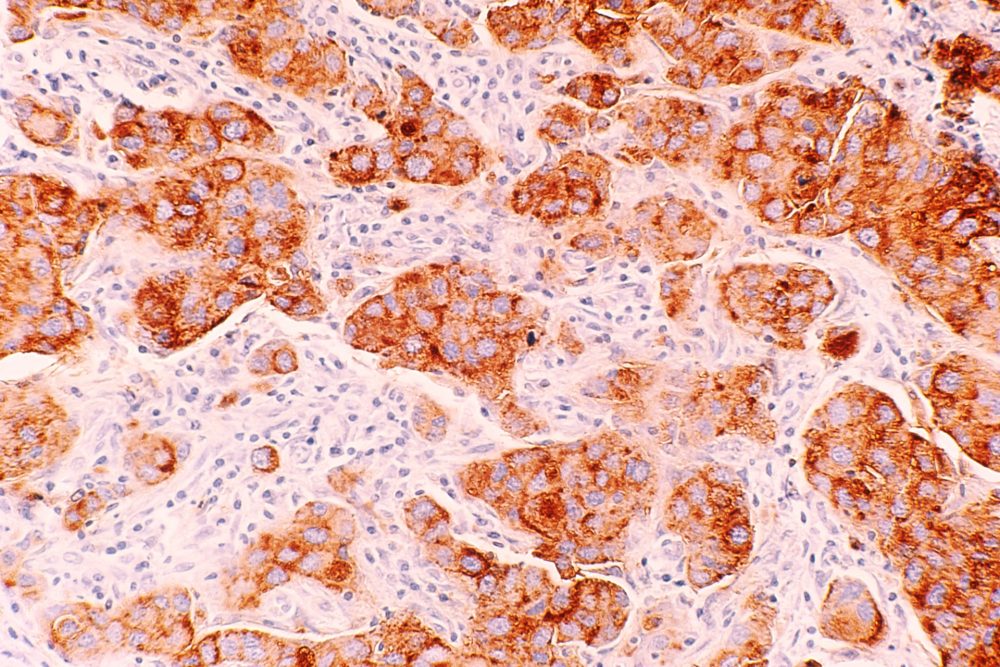
Nonetheless, another crucial point in addressing CTC identification in comparison with normal cells involves a foundational understanding of the physical and morphological differences that aid in recognizing cancer recurrence. Generally, cancerous cells among one another illustrate the variation in size and shape, while there tends to be a general conformity of such for normal cells.12 Normal cells tend to have smaller, uniformly shaped nuclei while cancer cells often contain larger, oddly shaped nuclei.13 Consequently, normal cells have far more relative cytoplasmic volume than that of cancerous cells.14 Cancerous cells also bear a greater amount of epithelial surface markers, this is represented by high levels of epithelial cell surface antigens and cytokeratin, a common marker.15 Common proteins aid in CTC identification based on the presence of surface antigens including the protein EpCAM, or even identifying cells as CD45+, as this antigen is a marker for lymphocyte cell separation.16 Furthermore, these epithelial cell surface antigens could be determining the presence of estrogen and progesterone receptors in breast cancer-specific patients.17 Even 15% of breast cancer cells are positive for human epidermal growth factor receptor 2, or HER2.18 Distinguishing the physical abnormalities of CTCs aids in an understanding of what should be analyzed and examined in the application of flow cytometry, to detect cancer recurrence.
Increasing CTC Concentration in Blood Samples
CTC concentration portrays a medical dilemma and consequently has been targeted through three major approaches. Firstly there is an adverse selection which involves removing a vast amount of normal blood cells to amplify the remaining CTCs.19 This method requires the ability of antibodies in recognizing cancer-specific epitopes.20 The multi-marker immuno-magnetic negative depletion enrichment of CTCs (MINDEC), utilizes a density gradient centrifugation and superparamagnetic beads which employ antibodies.21 Nonetheless, this enrichment strategy has proved efficient; however, the result often still contains an extraordinary abundance of white blood cells (WBCs).22 Secondly, there is a positive selection that focuses on CTC concentration through either the lens of physical or biological properties.23 An FDA-approved system known as CellSearch demonstrates positive selection by using ferromagnetic beads covered in EpCAM (an epithelial cell surface marker), to remove CTCs.24 Following such it states them using fluorescent dyes which aid in the imaging process to analyze the cell morphology.25 The reliability of this method has already been adapted to the identification of metastatic breast cancer, however, it proved inefficient in distinguishing CTCs which are EpCAM(-).26 Finally, there are imaging technologies that essentially skip over the issue of amplifying CTC concentration and instead focus on the interrogation of single cells to gain analytic information.27 These systems of CTC visualization include DEPArray, which performs micromanipulation through electrostatic charge.28 While doctors could present the benefit of turning towards these imaging platforms, flow cytometry still proves a valuable tool to the medical community for its ability to single-handedly offer information regarding multiple physical abnormalities of CTCs through the use of different dyes and sensors. Continually the existence of both negative and positive selection proves that CTC concentration issues have been addressed previously and going forward it will be understood that such can be amplified and therefore resolved.
Understanding Flow Cytometry
Having addressed concentration issues and physical differences to implement flow cytometry as a large-scale method of identifying CTCs, the focus will narrow in on the inner workings of a flow cytometry device. A general understanding of flow cytometry includes measuring physical or chemical cell properties using a pressurized fluidics system that delivers cells in a single file to the point of interrogation. The sample taken from the patient, containing cells and particles, is dyed using an antibody-fluorochrome conjugate.29 Current staining for breast cancer patient samples includes nuclear staining with DAPI, which results in a blue color, and cytokeratin staining with pan-cytokeratin resulting in a green color.30 Following such, a fluid suspends the cells that are then sent to a flow cytometer and distributed into a single line through a central core enclosed by an outer sheath fluid.31 The narrowing of the sheath, as seen in Figure 1, and increasing fluid velocity stretch the cells to form a single file through the point of interrogation.32 At this point, the cells pass through one or multiple laser beams of varying light sources in terms of wavelength.33 The scatter of the light through the cell gives information regarding the cell’s properties.34 The light scatter in the forward direction, which is 20 degrees offset from the access of the laser beam, is collected by the forward scatter channel of FSC.35 This forward scatter specifically provides information about the size of the cells, as larger cells will have more refracted light than smaller ones.36 Returning to light scatter, that 90 degrees offset from the axis of the laser beam is collected by the side scatter channel or SSC and can relay data regarding the granularity of the cell or its internal structures.37 The following represents a visual aid to demonstrate the inner workings of a flow cytometry machine:
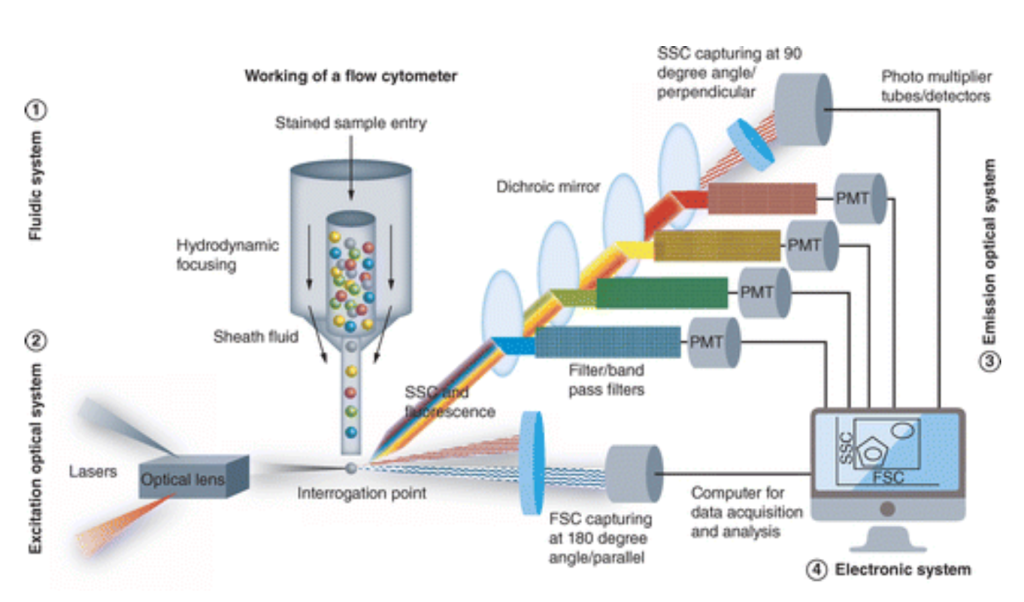
As detailed above in the photograph, the FSC and SSC gathered from the PMT are then plugged into an electronic system that graphically displays analytical information based upon the amount of like refracted through at that direction, and through such specific filters. The flow cytometry then utilizes these forms of photomultiplier tubes or PMTs, known as the FSC and SSC, to detect scatter based on optical filters depending on which of the device’s three filter types.39 These three types are long, short, and bandpass filters, allowing light above a cutoff wavelength, light below a cutoff wavelength, and light within a specified range of wavelengths.40 As these cells pass through the laser and the light scatter is measured, the device records a single pulse, representing the current detected from the anode of the PMTs.41 This measure is then quantified by varying factors; the axes of such data compare the photocurrent to time, utilizing height and area demonstrated on the graph to measure signal intensity, while width relays the time the cell spent in the laser.42 Specific flow cytometry machines can analyze up to 100 thousand cells per second.43 An example of a graph is positioned below.
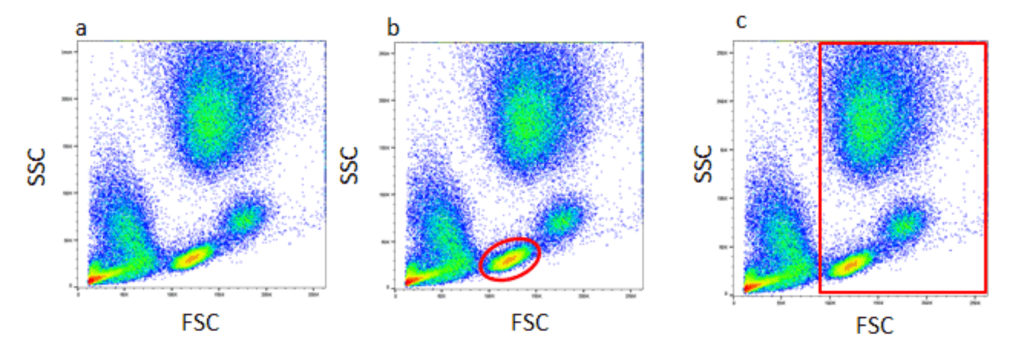
This data analysis utilizes gating based on the commonalities identified through forward and side scatter. Figure 2, demonstrates a density plot graph comparing forward and side scatter gathered by the flow cytometry.45 The hotspots of color indicate cell events, due to a greater amount of light scatter gathered, which is heavily influenced by the viability of the dyes used.46 Nonetheless, these scatter plots provide doctors with information regarding specific commonalities, for instance identifying a dye to stain cytoplasmic contents, therefore, identifying cells with larger/smaller levels of those contents through a graph. Consequently, current flow cytometry devices can be purchased by hospitals in combination with data analytical devices that aid in understanding the scatter plots above to make definitive decisions regarding the abnormalities between cells, and the possibility of finding CTCs. Building a general foundation for the systematic process of flow cytometry in analyzing a single cell’s properties and the resulting data provides a background of the utilization such could prove within the medical field. Current Devices & Field Utilization
Despite flow cytometry’s versatility and efficiency, FDA approval to move such from cynical trials to widespread application has only occurred in recent years. In 2017 the FDA approved Beckman Coulter’s CLearLLab Reagents, which is a flow cytometry test specifically used to identify cancer, including leukemia and lymphoma.47 At the time of clinical trials, it proved to correctly identify the presence of cancerous cells 84.2% of the time.48 In the following years, by 2020, Becton Dickinson also gained FDA approval for their FACSLyric flow cytometer and integrated BD FACSDUet sample preparation system.49 However, focusing on more modern machinery, cell sorting devices can be purchased on a large scale by medical facilities, including the CytoFLEX Platform with CytoFlex SRT.50 This flow cytometry has 15 fluorescent detectors and four mixed mode sorting and has resulted in not only high recovery of cells but also post-sort viability.51 Continually it can obtain accurate single-cell deposition with the Cyclone Movement System which sorts the cells into tubes, slides, or microplates.52 This machinery by Beckman Coulter requires receiving a direct estimate from the company; however, based on the digital market, the Cytoflex flow cytometer costs approximately 200,000 USD.53 Meanwhile, the estimated cost of the CytoFlex SRT benchtop sorter containing seven colors and two lasers is about 312,801 USD. However, this broadly ranges based on the number of colors and lasers it uses to measure and analyze cellular properties.54 Wide-spread application requires a focus on cost efficiency, regardless of powering costs, but simply for the narrowed perspective of purchasing the necessary machinery in terms of time efficiency at which the flow cytometer runs. Another device developed by Beckman Coulter includes MoFlo Astrios Cell Sorter EQ which, while utilizing a seven laser system, can also perform beadless drop delay and 6-way sorting into 1536 healthy plates.55 More importantly, it is capable of 70,000 sort decisions/ second and has an automated system with the capability to detect 44 parameters and process more than 100,000 events/double acquisition rate.56 Rapidly medical technologies appear and advance, but the utilization of flow cytometry remains a powerful tool for cancer research and diagnosis.
Flow cytometry, despite the understanding that impediments of concentration and distinguishability exist, can be extremely effective in the early diagnosis of metastatic cancers, especially breast cancer. The commonality of breast cancer and identifiability using the presence of hormone receptors and physical abnormalities proves that such can be quantifiably different at the level of cell structure. Therefore flow cytometry, for its efficiency and adaptability towards varying CTC identification, based on the tested-for distinguisher, should be moved into application on a larger scale than simply clinical trials.
References
1. Mohan, S., Chemi, F., & Brady, G. (2017, August 24). Challenges and unanswered questions for the next decade of circulating tumour cell research in lung cancer. Translational Lung Cancer Research. Retrieved July 3, 2023, from https://tlcr.amegroups.com/article/view/14564/html
2-3. Lustberg, M., Jatana, K., Zborowski, M., & Chalmers, J. (2012). Emerging Technologies for CTC Detection Based on Depletion of Normal Cells. National Library of Medicine. https://doi.org/10.1007/978-3-642-28160-0_9
4. “Basic Information about Breast Cancer.” Centers for Disease Control and Prevention, 26 Sept. 2022, www.cdc.gov/cancer/breast/basic_info/index.htm#:~:text=Each%20year%20in%20the%20United,each%20year%20 from%20breast%20cancer.
5. “Breast Cancer Recurrence: Types, Symptoms and Risk.” City of Hope, 18 Feb. 2022, www.cancercenter.com/cancer-types/breast-cancer/types/rare-breast-cancer-types/recurrent-breast-cancer.
6-7. Flow Cytometry: Cell Analysis vs. Cell Sorting. (n.d.). Bio-Rad. Retrieved July 3, 2023, from https://www.bio-rad.com/en-us/feature/flow-cytometer.html
Flowcytometry Paper w/ Abstract & Works Cited
8-10. Mohan, S., Chemi, F., & Brady, G. (2017, August 24). Challenges and unanswered questions for the next decade of circulating tumour cell research in lung cancer. Translational Lung Cancer Research. Retrieved July 3, 2023, from https://tlcr.amegroups.com/article/view/14564/html
11. “Blood and the Cells It Contains – Blood Groups and Red Cell Antigens …” National Library of Medicine, www.ncbi.nlm.nih.gov/books/NBK2263/. Accessed 31 July 2023.
12-13. Eldridge, L. (2023, April 21). Cancer Cells vs. Normal Cells: How Are They Different? Verywell Health. Retrieved July 3, 2023, from https://www.verywellhealth.com/cancer-cells-vs-normal-cells-2248794
14 “Tumor Cell Morphology – Comparative Oncology – NCBI Bookshelf.” National Library of Medicine, www.ncbi.nlm.nih.gov/books/NBK9553/. Accessed 31 July 2023.
15-16. Jachimowicz, L., Lei, M., Ye, P., & Guenther, G. (2020, July 30). Detection of Rare Cells and Circulating Tumor Cells using Flow Cytometric Methods. Agilent Technologies. https://www.agilent.com/cs/library/applications/5994-2110EN-an-CTC-Rare_cell_detection.pdf
17-18. Understanding your new breast cancer diagnosis. (2020, October 14). UCLA Health. Retrieved July 3, 2023, from https://www.uclahealth.org/news/understanding-your-new-breast-cancer-diagnosis
19-28. Mohan, S., Chemi, F., & Brady, G. (2017, August 24). Challenges and unanswered questions for the next decade of circulating tumour cell research in lung cancer. Translational Lung Cancer Research. Retrieved July 3, 2023, from https://tlcr.amegroups.com/article/view/14564/html
29-30. Lustberg, M., Jatana, K., Zborowski, M., & Chalmers, J. (2012). Emerging Technologies for CTC Detection Based on Depletion of Normal Cells. National Library of Medicine. https://doi.org/10.1007/978-3-642-28160-0_9
31-37. Flow Cytometry: Cell Analysis vs. Cell Sorting. (n.d.). Bio-Rad. Retrieved July 3, 2023, from https://www.bio-rad.com/en-us/feature/flow-cytometer.html
38. C, Binod G. “Figure 1.” The Science Notes, 12 Feb. 2023, https://thesciencenotes.com/wp-content/uploads/2023/02/flow111-1.gif. Accessed 31 July 2023.
39-43. Flow Cytometry: Cell Analysis vs. Cell Sorting. (n.d.). Bio-Rad. Retrieved July 3, 2023, from https://www.bio-rad.com/en-us/feature/flow-cytometer.html
44-46. “Figure 2.” Bio-Rad, https://static.bio-rad-antibodies.com/2016/flow-cytometry/gating-strategy/figure-1.png. Accessed 31 July 2023.
47-48. FDA Authorizes First Flow Cytometry Test to Help Detect Leukemias and Lymphomas. (2017, September 1). AACC. Retrieved July 3, 2023, from https://www.aacc.org/cln/articles/2017/september/fda-authorizes-first-flow-cytometry-test-to-help-detect-leukemias- and-lymphomas
49 Crotti, N. (2020, October 6). BD’s automated flow cytometry system wins FDA clearance. Medical Design and Outsourcing. Retrieved July 3, 2023, from https://www.medicaldesignandoutsourcing.com/bds-automated-flow-cytometry-system-wins-fda-clearance/
50-52. CytoFLEX SRT Benchtop Cell Sorter. (n.d.). Beckman Coulter. Retrieved July 3, 2023, from https://www.beckman.com/flow-cytometry/cell-sorters/cytoflex-srt
53. CytoFLEX Flow Cytometer by Beckman Coulter Life Sciences. (n.d.). SelectScience.Retrieved July 3, 2023, from https://www.selectscience.net/products/cytoflex-flow-cytometer/?prodID=204015#:~:text=%22Beckman%20Coulte r’s%20flow%20cytometry%20%E2%80%9CThe,not%20expensive%2C%20approximately%20%24200%2C000%2 0USD.
54. CytoFLEX SRT Bench Top Cell Sorter, Beckman Coulter. (n.d.). VWR. Retrieved July 3, 2023, from https://us.vwr.com/store/product/37368045/null
55. MoFlo Astrios Cell Sorter. (n.d.). Beckman Coulter. Retrieved July 3, 2023, from https://www.beckman.com/flow-cytometry/cell-sorters/moflo-astrios-eq
About the author
Anjali Ramakrishnan
Anjali is a rising senior at the Episcopal Academy. Throughout high school, she has pursued science both inside and outside of the classroom including through the Pennsylvania Junior Academy of Science. Anjali has always found biomedical engineering to be a fascinating field and hopes to continue studying engineering in college. In her free time, she enjoys baking desserts and spending time with loved ones.