

Author: Temitope Ogunyomi
Mentor: Dr. Sadegh Asgari
Foster High School
Abstract
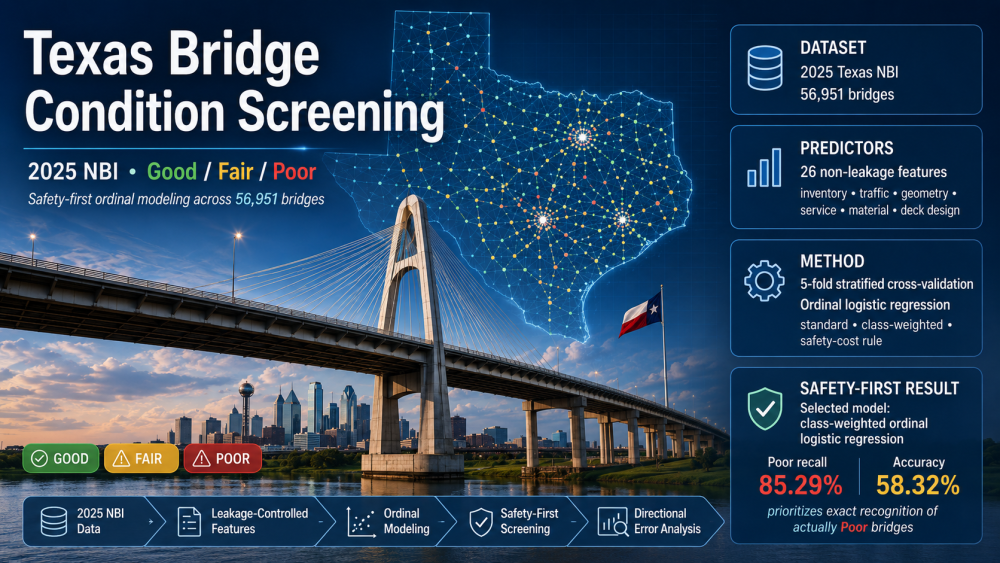
Texas maintains the largest state bridge inventory in the United States, creating a need for transparent tools that can support condition screening across a large network. We evaluate the 2025 Texas National Bridge Inventory (NBI), which contains 56,951 bridges labeled Good, Fair, or Poor. We aim to predict the bridge condition using 26 features including inventory, traffic, geometric, service, material, and deck-design while excluding component ratings and other fields that would leak the target. Cumulative-threshold ordinal logistic regression is evaluated with a five-fold stratified cross-validation procedure. We compare three operating approaches: standard ordinal logistic regression, fully class-weighted ordinal logistic regression, and a directional safety-cost decision rule applied to the standard model’s probabilities. The ordinary model provides the highest overall accuracy (72.45%) but identifies only 14 of 680 Poor bridges (2.05%). The class-weighted model identifies 580 Poor bridges (85.29% recall), and achieves 58.32% accuracy. The directional cost rule reduces the most severe Poor-to-Good error to 3 cases (lowest among all models) but identifies only 291 Poor bridges exactly and mislabels 386 as Fair. We therefore select the class-weighted model for a safety-first screening objective that prioritizes exact recognition of actually Poor bridges. Its 10,338 conservative Poor alerts create additional inspection workload, but they are not treated as the same safety failure as overlooking an actual Poor bridge. The study contributes a Texas-only, statewide 2025 Good/Fair/Poor evaluation with leakage control, reproducible validation, class-sensitive training, and explicit directional-error analysis.
Introduction
Bridge inspection data support decisions about maintenance, rehabilitation, replacement, and inspection scheduling. The National Bridge Inventory provides a consistent federal record of bridge attributes and condition information, making it a major source for data-driven infrastructure research. Texas is especially important because the 2025 NBI contains 56,951 Texas bridges, more than any other state. A network of this scale makes manual review of every record difficult and increases the value of transparent screening models that can organize attention without replacing engineering inspection.
Machine learning can relate observed condition labels to age, traffic, geometry, material, location, and other inventory characteristics. However, the apparent performance of a model depends on the target definition, the prediction horizon, the state or national population, and the treatment of class imbalance. In bridge data, Poor-condition examples are rare. A model can therefore achieve respectable overall accuracy by fitting the large Good and Fair groups while failing to recognize the class of greatest safety interest. This makes the confusion matrix, per-class recall and precision, balanced accuracy, and macro-F1 essential complements to accuracy.
The direction and distance of an error also matter because Good, Fair, and Poor are ordered. Any actual Poor bridge assigned Fair or Good is underpredicted; assigning it Good is the more severe two-level error because the label is especially reassuring. Errors in the opposite direction, such as assigning an actual Good or Fair bridge to Poor, are conservative over-alerts that may increase inspection workload but do not hide deterioration. We therefore make exact Poor recall and total Poor underprediction the primary safety measures, while still reporting accuracy, error direction, and false-alert burden for transparency.
We aim to (1) establish what prior research has and has not done with Texas NBI data; (2) distinguish training loss, class weighting, and post-training decision costs; (3) build a leakage-controlled ordinal classifier with 26 predictors; and (4) identify which transparent operating approach most effectively recognizes actually Poor bridges. The primary selection objective is to maximize exact Poor recall and minimize Poor bridges assigned to Fair or Good; Poor-to-Good remains the most severe type of underprediction.
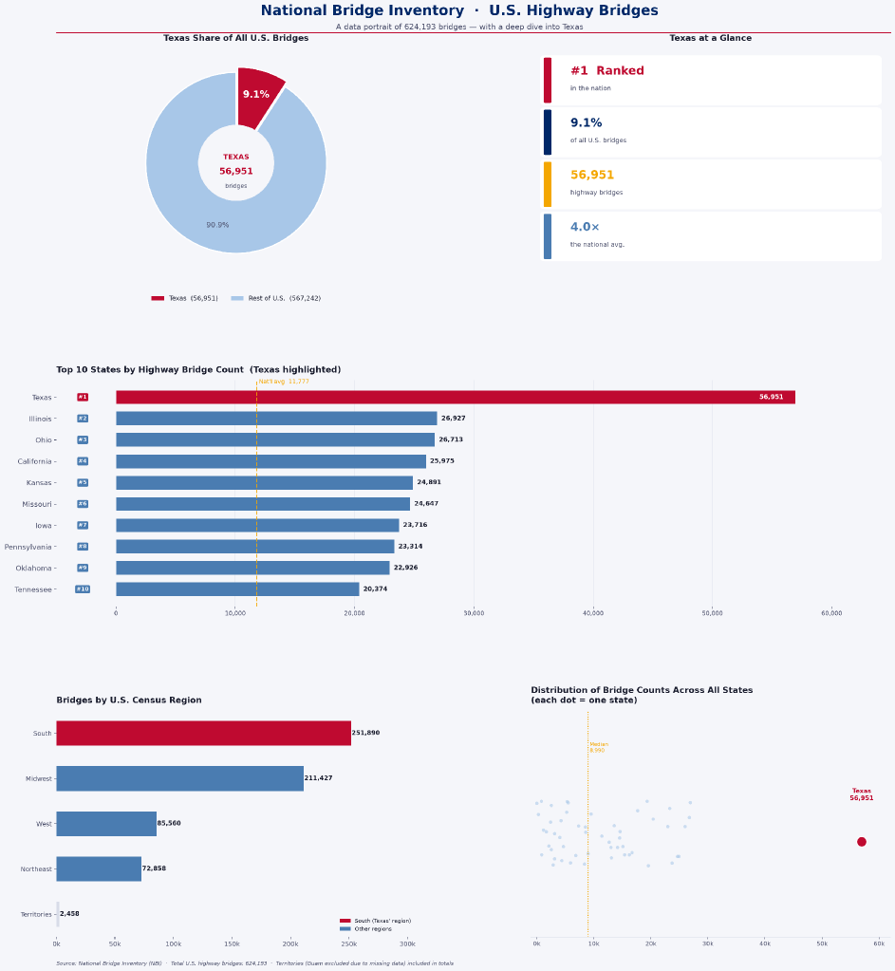
Source: Created by the author using the Federal Highway Administration’s 2025 National
Bridge Inventory data.
Background
Machine learning for bridge condition prediction using NBI dataset
Research using state and national NBI subsets has examined current condition classification, next-inspection prediction, and long-term deterioration trajectories. The targets are not interchangeable. Some studies predict deck, superstructure, or substructure ratings; others predict structural evaluation or an overall rating derived from the minimum component condition. Studies also differ in whether the original 0-9 NBI scale is retained, ratings are grouped into binary classes, or conditions are grouped as Good, Fair, and Poor. Reported accuracy values should therefore be interpreted inside each study’s target and validation design rather than ranked as if they measured the same task.
State-specific work demonstrates the usefulness of geographically focused modeling. Assaad and El-Adaway (2020) compared computational approaches for Missouri deck deterioration. Rashidi Nasab and Elzarka (2023) evaluated multiple algorithms and feature selection methods for Ohio concrete bridge decks. Mia and Kameshwar (2023) predicted future component-condition classes from Louisiana histories. Liu and El-Gohary (2020, 2022) used Washington bridge data and deep-learning methods for deterioration prediction. These studies show that state-specific models are established, but their component targets, history requirements, and imbalance methods differ from a single-year statewide overall-condition classifier.
National studies provide larger and more varied training populations. Fard and Fard (2024) used more than one million historical U.S. records to predict deck ratings with random forest, XGBoost, and artificial neural networks. Chand and Choe (2026) evaluated 142,265 U.S. reinforced-concrete bridges and reported state-level performance for Texas and other subgroups. Such work includes Texas data but does not constitute Texas-only training and testing. The distinction is important because a national model can learn interstate patterns that may not match a Texas-exclusive population.
What prior research has done specifically in Texas
The 2019 TxDOT report requires careful classification. Its title and abstract identify its main purpose as a synthesis of bridge service-life prediction methods and practices for Texas. It is not primarily a machine-learning bridge-condition paper. Nevertheless, Chapter 4 contains an embedded case study using 1994-2016 Texas NBI records. The case study used 289,529 bridge-year observations, designated NBI Item 67 structural evaluation as the response, compared Naive Bayes, logistic regression, and decision-tree classifiers, and used a 75/25 split. Table 7 reports 0.95 accuracy, precision, and recall for the decision tree. The source is therefore adjacent at the report level but direct within its embedded ML subsection (Gao et al., 2019, PDF pp. 58-60).
Fang et al. (2023) is a direct bridge-condition prediction article. Its introduction states that feature engineering was performed on Texas bridge inventory data. The authors built four binary models for deck, superstructure, substructure, and structural evaluation, grouping ratings 0-6 and 7-9. The model-development sample counts range from 34,764 to 55,476, and the target-specific held-out accuracies range from 77.62% to 88.57%. The implementation case is different: Section 5 applies the structural-evaluation model to South Carolina bridges. Fang et al. is therefore Texas-specific in model development but not Texas-exclusive from data preparation through practical application.
Zhang et al. (2024) is the closest verified Texas-only overall-condition forecasting precedent. The study uses Texas NBI histories from 1992 to 2022, selects features with ReliefF, trains an Elman neural network, and uses a Markov chain to describe future deterioration. The accessible article reports 5,600 eligible bridge histories and a 70/20/10 training, validation, and testing division. Its overall-condition target and Texas-only history are directly relevant, but its longitudinal prediction problem differs from the present cross-sectional 2025 Good/Fair/Poor classification.
Two 2025 studies further limit broad originality claims while clarifying the present gap. Bayat, Kharel, and Li (2025) is an ASCE Technical Paper in the Journal of Structural Design and Construction Practice. It predicts Texas bridge deck condition from TxDOT historical data using autoencoder representations with random forest, XGBoost, and neural networks. Bayat and Kharel (2025) is an open-access research article focused on 1,443 Texas off-system bridge samples, including only eight observations in Condition 4. It combines focal-loss GAN augmentation, Tomek Links, and random-forest classification to improve minority-condition recognition. Both are Texas-only condition studies, but both focus on component or off-system subsets rather than the complete 2025 statewide overall Good/Fair/Poor population.
Loss functions, imbalance, and ordinal safety
Cross-entropy, or log loss, is the standard objective for probabilistic multiclass classification. Class weighting modifies this objective so that errors from rare classes have greater influence during fitting. Focal loss modifies cross-entropy by reducing the influence of easy examples and emphasizing difficult examples. Liu (2019) compared multiclass focal loss with cross-entropy for bridge deterioration, and later studies by Liu and El-Gohary (2020, 2022) extended focal-loss bridge analytics. Bayat and Kharel (2025) provides a direct Texas precedent for focal-loss-based imbalance treatment. Focal loss is therefore not itself a new Texas bridge contribution.
Sampling procedures must be discussed separately. SMOTE and ADASYN synthesize minority observations, undersampling removes majority observations, Tomek Links cleans overlapping class boundaries, and GANs generate additional data. These methods change the training sample rather than the loss. If used, they must be fitted only inside training folds to avoid contamination of validation or test data. The present first experiment uses class weighting because it is easy to audit and does not generate synthetic combinations of coded inventory attributes.
Class weighting and focal loss change how strongly training emphasizes difficult or rare examples. We use cumulative-threshold logistic regression to respect the order Poor < Fair < Good and compare ordinary training with full inverse-frequency class weighting. We also apply a directional cost matrix to the ordinary model’s probabilities as a sensitivity analysis. The cost matrix is a post-training decision rule, not a separately trained third model. Because this study’s primary safety objective is exact recognition of actually Poor bridges, the final approach is selected by Poor recall and total Poor underprediction rather than average cost alone.
Positioning of the present study
The verified literature does not support a claim that machine learning has never been used to model Texas bridge condition. It does support a narrower contribution. None of the verified sources matches the complete combination of the official 2025 Texas population, an overall ordered Good/Fair/Poor target, 26 leakage-controlled predictors, pooled five-fold stratified validation, and an explicit comparison of severe underprediction with false-alert burden. We therefore describe the contribution as a distinct statewide modeling and evaluation design rather than the first use of machine learning on Texas bridges.
| Study | Geography | Purpose | Target | Complete 2025 TX | Imbalance | Directional safety |
| TxDOT 2019 | TX only | Embedded case | Structural evaluation | No | No | No |
| Fang et al. 2023 | TX model / SC case | Direct | Four binary component/evaluation targets | No | No | No |
| Zhang et al. 2024 | TX only | Direct | Long-term overall rating | No | No | No |
| Bayat et al. 2025 | TX only | Direct | Deck condition | No | No | No |
| Bayat & Kharel 2025 | TX off-system | Direct | Deck/technical condition | No | Focal/GAN | No |
| 2026 hybrid AI study | U.S.; TX subgroup | Direct | National condition prediction | Partial | NR | No |
| Present study | TX only | Direct | Ordered overall G/F/P | Yes | Class weights | Ordinal + directional cost |
Source: Created by the author from the studies cited in the literature review.
Methodology
Dataset, Preprocessing, and Feature Engineering
We use the Federal Highway Administration’s (FHWA) 2025 National Bridge Inventory dataset for Texas. Each row represents one bridge record, and the structure identifier is unique in the analysis file. The final population contains 56,951 bridges. The target is the FHWA bridge-condition category: Good (G), Fair (F), or Poor (P). The distribution is 29,423 Good bridges (51.66%), 26,848 Fair bridges (47.14%), and 680 Poor bridges (1.19%). The severe imbalance of the Poor class motivates class-sensitive evaluation.
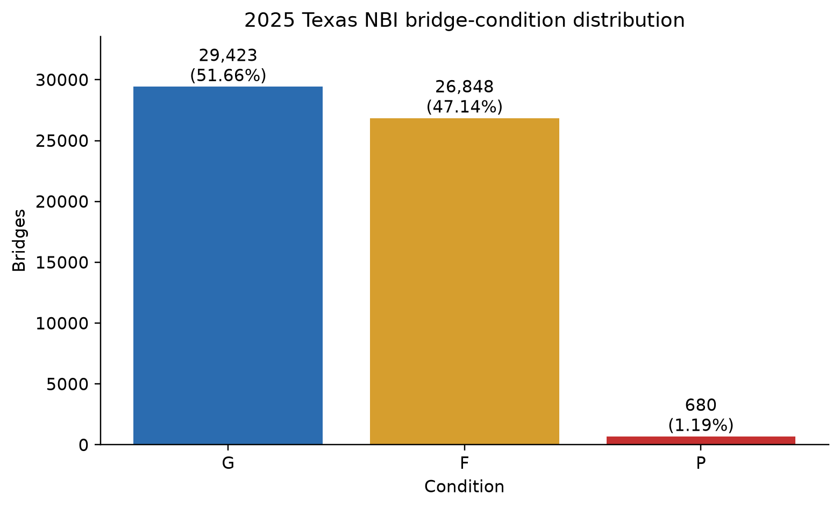
Source: Created by the author using the FHWA 2025 Texas National Bridge Inventory (TX25.txt).
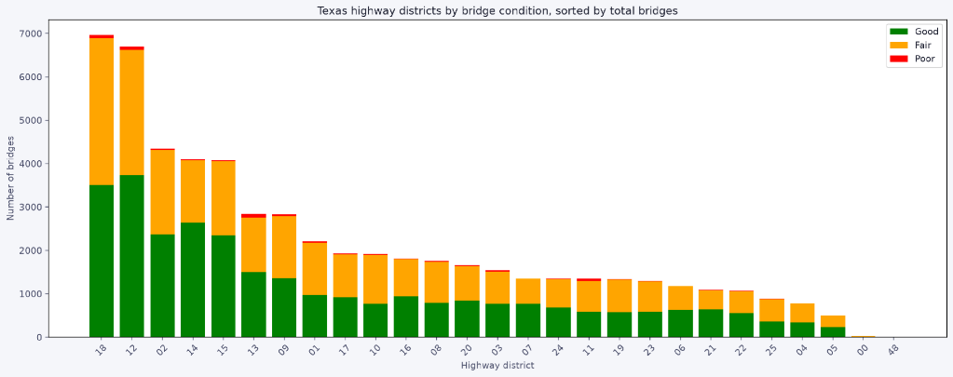
Source: Created by the author using the FHWA 2025 Texas National Bridge Inventory (TX25.txt).
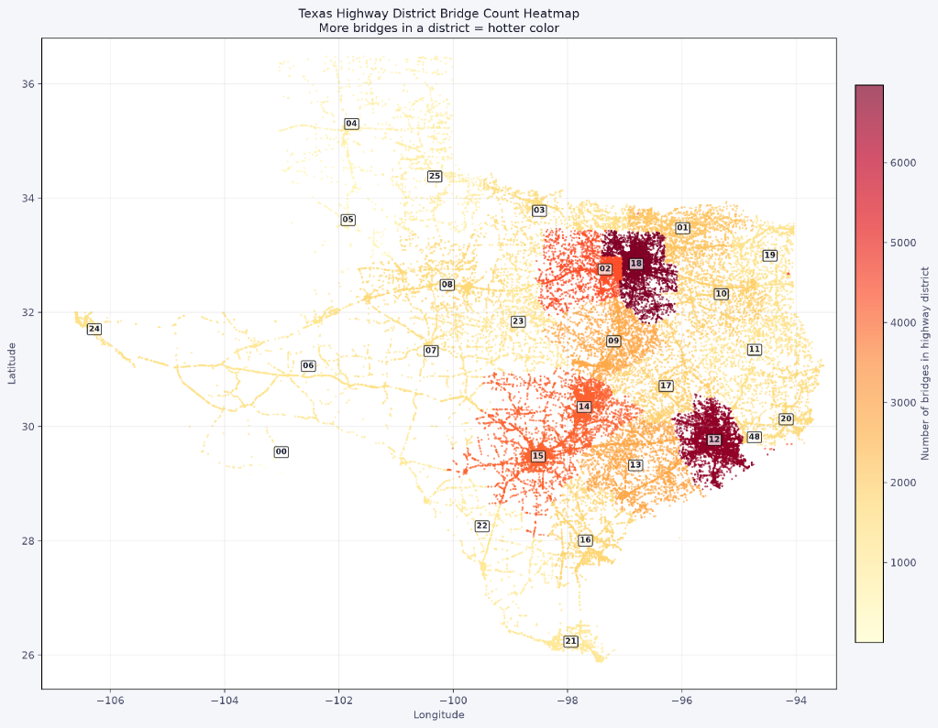
Source: Created by the author using the FHWA 2025 Texas National Bridge Inventory (TX25.txt).
Twenty-Six Features and Leakage Control
We use 26 predictors. Fourteen are numeric:
Age_027,
Age_Reconstructed_106,
TRAFFIC_LANES_ON_028A,
TRAFFIC_LANES_UND_028B,
ADT_029,
DEGREES_SKEW_034,
MAIN_UNIT_SPANS_045,
APPR_SPANS_046,
MAX_SPAN_LEN_MT_048,
STRUCTURE_LEN_MT_049,
ROADWAY_WIDTH_MT_051,
APPR_WIDTH_MT_032,
DECK_WIDTH_MT_052,
PERCENT_ADT_TRUCK_109.
Twelve coded fields are categorical:
SERVICE_LEVEL_005C,
BASE_HWY_NETWORK_012,
FUNCTIONAL_CLASS_026,
DESIGN_LOAD_031,
SERVICE_ON_042A,
SERVICE_UND_042B,
STRUCTURE_KIND_043A,
STRUCTURE_TYPE_043B,
DECK_STRUCTURE_TYPE_107,
SURFACE_TYPE_108A,
MEMBRANE_TYPE_108B,
DECK_PROTECTION_108C.
Age_Reconstructed_106 uses the reconstruction year when it is positive and otherwise falls back to the original build year.
Deck, superstructure, substructure, culvert, structural-evaluation, and lowest-rating fields are excluded. The bridge-condition target is derived from component condition information, so using those fields as predictors would allow the model to recover the label directly and inflate performance. The structure identifier is retained only for uniqueness and audit checks, not as a predictor. All preprocessing is contained within the model pipeline so that imputation, scaling, and category encoding are learned separately from each training fold rather than from held-out records.
Model Development and Validation
We use five-fold stratified cross-validation as the primary validation design. Records are shuffled with random seed 42 and divided into five approximately equal folds. Each bridge is evaluated once by a model that was not trained on that bridge, producing one pooled out-of-fold prediction for every record. Imputation, scaling, category encoding, and any class weights are learned only from each training fold. Pooling the five validation folds produces a confusion matrix over all 56,951 bridges while preserving out-of-sample evaluation for every record. We fit cumulative-threshold ordinal logistic regression. One binary logistic equation estimates whether condition is above Poor, and a second estimates whether condition is above Fair; the two outputs are combined into valid Good/Fair/Poor probabilities. We evaluate three operating approaches on identical folds: (1) ordinary ordinal logistic regression with the highest-probability prediction, (2) the same ordinal structure with full inverse-frequency class weighting during training, and (3) a directional safety-cost sensitivity rule applied to the ordinary model’s probabilities. The third approach changes the final decision, not the fitted coefficients. The class-weighted model is the selected safety-first model because it yields the highest exact Poor recall and the fewest total Poor underpredictions.
| Actual condition | Predict Good | Predict Fair | Predict Poor |
| Good | 0 | 1 | 1 |
| Fair | 5 | 0 | 1 |
| Poor | 20 | 10 | 0 |
Source: Created by the author for this study.
How to read Table 2: a cost is a decision weight, not a number of bridges. For an actual Poor bridge, predicting Good receives the largest penalty (20), while predicting Fair receives a smaller penalty (10). This ordering reflects the study’s assumption that a Good label is the most falsely reassuring outcome. For each bridge, the selected prediction is the class with the lowest expected cost after the model probabilities are multiplied by the matrix. A zero on the diagonal represents a correct prediction.
Why Logistic Regression?
We use logistic regression because it is a standard baseline for classification, its coefficients and predicted probabilities are inspectable, and the calculation is simple enough to reproduce in a spreadsheet after preprocessing. These properties make the model easier to audit than a more complex black-box method. The ordinal cumulative-threshold construction also uses the known order Poor < Fair < Good rather than treating the labels as unrelated categories.
Evaluation Protocol and Metrics
We compute every metric from the pooled five-fold out-of-fold confusion matrix. For each class k, TP is the number correctly predicted as k, FP is the number incorrectly predicted as k, and FN is the number of actual k bridges assigned another label. Accuracy measures all exact classifications. Precision asks how often a predicted class is correct; recall asks how much of an actual class is found; and F1 balances precision and recall. Balanced accuracy and macro-F1 give each class equal influence. Because Poor is rare and underprediction is the main safety concern, we also report exact Poor recall, the Poor-underprediction rate, Poor-to-Good and Poor-to-Fair counts, and false Poor alerts. The model-selection hierarchy is: first maximize exact Poor recall, then examine the severity of remaining underpredictions and overall accuracy. Conservative false Poor alerts are reported as workload rather than treated as the same safety failure.
Accuracy = (TP_G + TP_F + TP_P) / N
Precision_k = TP_k / (TP_k + FP_k)
Recall_k = TP_k / (TP_k + FN_k)
F1_k = 2(Precision_k x Recall_k) / (Precision_k + Recall_k)
Balanced accuracy = (Recall_G + Recall_F + Recall_P) / 3
Macro-F1 = (F1_G + F1_F + F1_P) / 3
Poor underprediction rate = (Poor-to-Good + Poor-to-Fair) / Actual Poor
Results & Discussion
Five-fold cross-validated performance
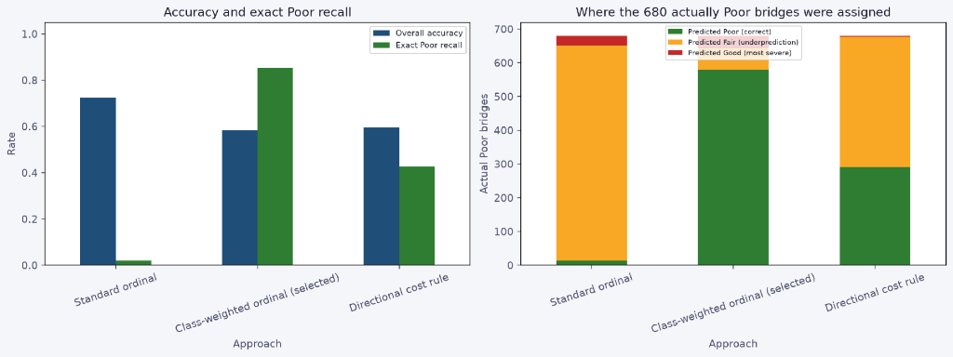
Source: Created by the author from the study’s five-fold cross-validated model results.
| Approach | Accuracy | Balanced acc. | Macro-F1 | Poor precision | Poor recall | Poor F1 | Poor mislabeled |
| Standard ordinal | 72.45% | 49.54% | 49.85% | 31.82% | 2.06% | 3.87% | 97.94% |
| Class-weighted (selected) | 58.32% | 66.45% | 44.03% | 5.31% | 85.29% | 10.00% | 14.71% |
| Directional cost rule | 59.57% | 55.02% | 45.87% | 15.74% | 42.79% | 23.01% | 57.21% |
Source: Created by the author from the study’s five-fold cross-validated model results.
| Approach | Correct G | Correct F | Correct P | P→G | P→F | G→P | False Poor |
| Standard ordinal | 21,660 | 19,588 | 14 | 29 | 637 | 0 | 30 |
| Class-weighted (selected) | 22,986 | 9,650 | 580 | 37 | 63 | 1,850 | 10,338 |
| Directional cost rule | 9,227 | 24,407 | 291 | 3 | 386 | 84 | 1,558 |
Source: Created by the author from the study’s five-fold cross-validated model results.
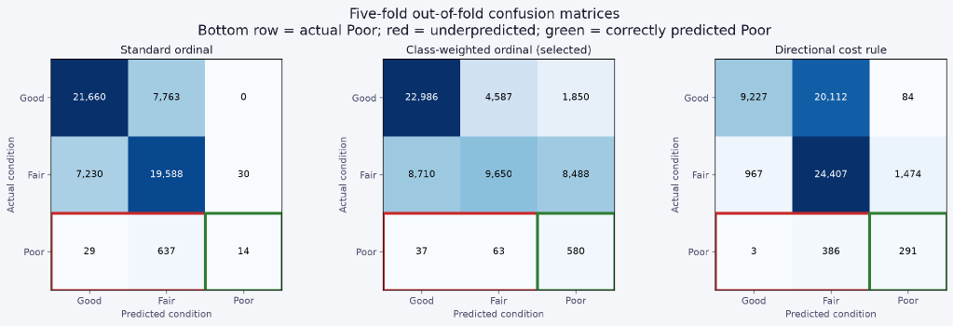
underpredicted as Good or Fair and green outlines correctly predicted Poor bridges.
Source: Created by the author from the study’s five-fold cross-validated model results.
The ordinary ordinal model has the highest accuracy, 72.45%, because it performs well on the dominant Good and Fair classes. It correctly identifies only 14 of 680 Poor bridges, however, for 2.06% Poor recall. Twenty-nine actual Poor bridges are labeled Good and 637 are labeled Fair. Overall accuracy alone therefore does not provide adequate evidence for rare-condition screening.
Full class weighting is the selected safety-first model. It identifies 580 of 680 actually Poor bridges as Poor, giving 85.29% Poor recall, and underpredicts only 100 Poor bridges: 63 as Fair and 37 as Good. This is the smallest total Poor underprediction among the three approaches. Its overall accuracy is 58.32%. It also produces 10,338 predicted-Poor alerts for actual Fair or Good bridges, including 1,850 Good-to-Poor conservative two-level errors. Under the study’s stated objective, these are accepted as additional inspection workload because they do not hide an actual Poor bridge.
The directional cost rule is retained as a sensitivity analysis. It reduces actual-Poor-to-predicted-Good errors to 3 of 680, but 386 Poor bridges are labeled Fair and only 291 are labeled Poor. Exact Poor recall is therefore 42.79%, and the total Poor-underprediction rate is 57.21%. Although the rule has the lowest average directional cost under Table 2, that average also rewards avoiding thousands of conservative false-Poor alerts. It does not match the present safety-first preference, which accepts those alerts in exchange for recognizing more actually Poor bridges exactly.
Implications for loss functions and decision costs
The three approaches answer different operational questions, but the paper makes one primary recommendation. If statewide exact accuracy is the only objective, the ordinary model is strongest. For the study’s safety-first objective – assigning as many actually Poor bridges as possible to Poor and accepting conservative alerts – the class-weighted ordinal model is strongest. The directional cost rule is preferable only under a different objective that places greater weight on reducing false-Poor workload and specifically minimizing Poor-to-Good errors, even when many Poor bridges remain labeled Fair.
Reproducibility
The polished analysis notebook downloads the official FHWA TX25.txt file, records its SHA-256 hash, constructs the 26 predictors, fixes randomized operations at seed 42, fits preprocessing only within training folds, and regenerates every table and figure. It also preserves a bridge-level interactive map. The processed dataset and code are available upon request.
Limitations
This analysis is cross-sectional. It classifies 2025 condition labels from 2025 inventory attributes and does not yet demonstrate prediction of a future inspection rating. A future forecasting study should construct bridge histories, use earlier years as predictors, and evaluate a later year or multi-year horizon without allowing future information into training. Five-fold random validation measures within-year generalization; geographic, district-held-out, and temporal validation may be more demanding.
The directional cost matrix is an explicit research assumption rather than a calibrated agency cost model. Its values should be reviewed with bridge engineers and asset managers. Poor precision in the selected class-weighted model is limited because only 1.19% of the inventory is Poor, so conservative screening creates many additional inspections. That workload is a real operational limitation even though it is not the same safety error as overlooking deterioration. The cumulative-threshold logistic model is transparent and respects class order but may not capture nonlinear relationships. The literature review is focused rather than registered and systematic, so the contribution claim remains limited to the verified sources. Future work should add temporal and district-held-out validation and should calibrate the class weights and decision costs with agency inspection capacity.
Conclusion
We conclude that statewide Texas bridge-condition modeling should be evaluated against the decision it must support, especially the consequence of underpredicting an actually Poor bridge. The ordinary ordinal model reaches 72.45% accuracy but identifies only 14 of 680 Poor bridges. The selected class-weighted ordinal model identifies 580 Poor bridges exactly, achieving 85.29% Poor recall and reducing total Poor underpredictions to 100. The directional cost rule reduces Poor-to-Good errors to 3 but identifies only 291 Poor bridges exactly and leaves 386 in Fair. Therefore, class weighting provides the best match to the study’s safety-first objective.
Our recommendation is qualified. The selected model’s 58.32% accuracy is lower than the ordinary baseline, its Poor precision is 5.31%, and it generates 10,338 conservative Poor alerts for actually Fair or Good bridges. It should therefore be used as a screening model whose Poor predictions trigger review, not as an autonomous condition assignment or a replacement for inspection. The ordinary model remains stronger when raw accuracy is the sole objective, while the directional cost rule remains useful when minimizing Poor-to-Good errors and inspection workload is more important than maximizing exact Poor recall.
The literature establishes that Texas bridge-condition machine learning is not entirely new. Texas-only precedents include Zhang et al. (2024) and recent deck-focused studies, while Fang et al. (2023) uses Texas data for model development and a South Carolina implementation case. Our work remains distinct in its combined use of the complete 2025 Texas inventory, an overall ordered Good/Fair/Poor target, 26 leakage-controlled predictors, pooled five-fold out-of-fold evaluation, class-weighted ordinal modeling, and a directional cost sensitivity analysis. Future work should test future-year forecasting, district-held-out validation, nonlinear ordinal models, and engineer-reviewed class-weight and cost calibration.
References
Assaad, R., & El-Adaway, I. H. (2020). Bridge infrastructure asset management system: Comparative computational machine learning approach for evaluating and predicting deck deterioration conditions. Journal of Infrastructure Systems, 26(3). https://doi.org/10.1061/(ASCE)IS.1943-555X.0000572
Bayat, M., & Kharel, S. (2025). Leveraging artificial intelligence for predictive maintenance and condition rating of off-system bridges. Applied Sciences, 15(21), 11301. https://doi.org/10.3390/app152111301
Bayat, M., Kharel, S., & Li, J. (2025). An autoencoder-based machine- and deep-learning approach for predicting bridge deck conditions in Texas. Journal of Structural Design and Construction Practice, 30(4), 04025080. https://doi.org/10.1061/JSDCCC.SCENG-1799
Chand, P., & Choe, D.-E. (2026). Bridging the gap: A comprehensive analytical study of traditional, hybrid, and explainable AI for bridge condition prediction. Results in Engineering, 29, 109791. https://doi.org/10.1016/j.rineng.2026.109791
Fang, J., Hu, J., Elzarka, H., Zhao, H., & Gao, C. (2023). An improved inspection process and machine-learning-assisted bridge condition prediction model. Buildings, 13(10), 2459. https://doi.org/10.3390/buildings13102459
Fard, F., & Fard, F. S. N. (2024). Development and utilization of bridge data of the United States for predicting deck condition rating using RF, XGBoost, and ANN. Remote Sensing, 16(2), 367. https://doi.org/10.3390/rs16020367
Federal Highway Administration. (2025). National Bridge Inventory: Texas delimited data file (TX25.txt). https://www.fhwa.dot.gov/bridge/nbi/2025/delimited/TX25.txt
Federal Highway Administration. (n.d.). Specifications for the National Bridge Inventory. https://www.fhwa.dot.gov/bridge/snbi.cfm
Gao, L., Mo, Y.-L., Dhonde, S., Saldarriaga, D., Song, L., & Senouci, A. (2019). Synthesis of service life prediction for bridges in Texas: Final report (FHWA/TX-19/0-6938-1). Texas Department of Transportation. https://rosap.ntl.bts.gov/view/dot/63293/dot_63293_DS1.pdf
Liu, K. (2019). Machine learning-based analytics of structured and unstructured bridge data for data-driven bridge deterioration prediction [Doctoral dissertation, University of Illinois Urbana-Champaign]. https://www.ideals.illinois.edu/items/113975
Liu, K., & El-Gohary, N. (2020). A smart bridge data analytics framework for enhanced bridge deterioration prediction. Construction Research Congress 2020. https://par.nsf.gov/servlets/purl/10295991
Liu, K., & El-Gohary, N. (2022). Deep learning-based analytics of multisource heterogeneous bridge data for enhanced data-driven bridge deterioration prediction. Journal of Computing in Civil Engineering, 36(3). https://doi.org/10.1061/(ASCE)CP.1943-5487.0001018
Mia, M. M., & Kameshwar, S. (2023). Machine learning approach for predicting bridge components’ condition ratings. Frontiers in Built Environment, 9, 1254269. https://doi.org/10.3389/fbuil.2023.1254269
Rashidi Nasab, A., & Elzarka, H. (2023). Optimizing machine learning algorithms for improving prediction of bridge deck deterioration: A case study of Ohio bridges. Buildings, 13(6), 1517. https://doi.org/10.3390/buildings13061517
Scikit-learn developers. (n.d.). Model evaluation: Quantifying the quality of predictions. https://scikit-learn.org/stable/modules/model_evaluation.html
Zhang, T., Chen, H., Cui, X., Li, P., & Zou, Y. (2024). Condition rating prediction for highway bridge based on Elman neural networks and Markov chains. Applied Sciences, 14(4), 1444. https://doi.org/10.3390/app14041444
About the author

Temitope Ogunyomi
Temitope (Tope) O. Ogunyomi is a 12th-grade student at Foster High School in Richmond, Texas. Tope is a 3x Junior Olympian and Junior Olympic bronze medalist in track and field. Beyond athletics, he is interested in engineering, technology, machine learning, and using research to address real-world problems. Tope hopes to continue pursuing academic research and athletics in college while developing solutions that positively affect communities.