

Author: Gladys Cai
Mentor: Dr. Gayathri Narasimham
Conestoga High School
Abstract
This experiment on the mental health of Asian immigrants was conducted with the goal of determining the influence of three key factors on risk for mental health and openness to treatment among Asian immigrants and their descendants: English-language fluency, social connectivity, and cultural stigma. My personal reason for conducting this experiment was the mental health challenges of an immediate family member and their reservations about seeking professional help for over a decade. For this research experiment, a survey was drafted with questions concerning participants’ immigration history, fluency in English, social connectivity, and cultural attitudes toward mental health, etc., and sent out to volunteers.
Introduction
An often-overlooked issue in national discussions surrounding the rising influx of migrants into the United States is its potential impact on the mental well-being of immigrants, particularly those of Asian origin who are often dismissed as the “model minority”. Many previous studies have concluded that the majority of immigrants, regardless of ethnic background, experience lower levels of mental illness than native-born Americans (Breslau et. al. 2006), but this overlooks the possibility of cultural, social, and financial barriers to seeking diagnosis and treatment among migrants (Hong et. al. 2023, Lee et. al. 2021, Barry & Grilo 2002, Bacong & Doan 2022, Kim & Lee 2021).
My goal is to conduct a survey of mental health among individuals of Asian descent in my community and synthesize the results from this survey. Several studies have found that immigrants are at greater risk for mental health issues such as psychotic disorders (Kirmayer et. al. 2011), but while Asian Americans are reported to have a 17.3% overall lifetime rate of any psychiatric disorder, they are three times less likely to seek professional help for their conditions than Caucasian Americans (Nishi 2012). This experiment has personal meaning to me due to the struggles of a parent with mental wellness. I often witness mental health issues, and substance abuse issues within my school environment. My long-term plan is to seek out significant causes and suggest future improvements in providing the necessary healthcare for adolescents.
So far, my research has repeatedly noted three significant factors in determining disorder risk and willingness to seek help—English language proficiency, cultural stigma, and social connectivity (Bacong & Doan 2022, Kim & Lee 2021). I will pose questions regarding these topics in my public survey and use the responses to calculate their statistical significance in mental health among immigrants.
Background
Early days of (recorded) immigration
Since the beginning of the colonial period, immigration has been a cornerstone of American population growth. During the nation’s first century, society consisted mainly of those with ancestry from the British Isles, followed by German and Irish settlers, even smaller communities of Eastern, Southern, Central, and Southeastern Europeans, and pockets of Asian populations concentrated at the Gold Rush in California (“Immigration to US”). The Immigration Act of 1924 and the Immigration and Nationality Act of 1952 intended to preserve the then current demographic makeup with quotas on immigration, actively prohibiting all migrants from outside the Western Hemisphere, restricting the numbers of Eastern and Southern Europeans allowed in the country, and forming the U.S. Border Patrol.
National-origin quotas were finally abolished by the Immigration and Nationality Act of 1965, allowing for an influx of immigration from non-European countries and changing the ethnic demographics of the United States. Between 2000 and 2010, the US gained nearly 14 million immigrants and one million naturalized citizens, and China, India, Mexico became the leading countries of origin for both legal and overall immigration by 2013. In the mid-2010s, the Census Bureau regularly attributed gains of over one million in the American population to immigration, and though these numbers have decreased rapidly in recent years, with a net gain of just 244,000 new residents in 2021, immigration has started to make up a majority of population growth, due to increased death rates and decreased birth rates during, and since the COVID-19 pandemic. The overall numbers of Americans born outside of the United States are now reminiscent of levels last seen during the late 19th century.
Asian immigrants
In the 1830s, the first large influxes of Asian immigrants comprising those from China, Japan, Korea, India, and the Philippines began settling in Hawaii and western United States. Their main purpose was to flee economic upheaval, such as that caused by the Meiji Restoration in Japan, and to fulfill rising demand for labor during the establishment of island plantations and the California Gold Rush. Discrimination and lynchings were commonplace and anti-Asian immigration formed such as the Asiatic Exclusion League (“Asians and Asian Exclusion”). The Chinese Exclusion Act of 1882 prohibited virtually all immigration from China, forcing Chinese immigrants to defend their existing rights and ability to obtain citizenship as their children began to develop unique identities as Chinese-Americans (“Growth & Inclusion”). All Asian immigration was eventually prohibited by the Immigration Act of 1924, and waves of reforms in the mid-20th century only legalized small amounts of immigration from Asia and their paths to naturalization. The Immigration Act of 1965 replaced the anti-Asian exclusionary rules from its 1924 predecessor, allowing Asian American demographics to shift dramatically in the United States. Asian countries of China, India, and the Philippines had become major sources of foreign-born migrants in 2013, and Asian immigrants comprise 31% of all immigration to the United States by 2021. Korean, Vietnamese, Laotian, and Cambodian immigrants of the 20th century arrived to escape war or persecution, while Chinese and Filipino immigrants are more likely to enter the US with an educated background. Currently, Asian immigrants to the United States number over 24 million and make up 7.2% of the total population (“Asian Pacific Islander Population”)
Mental health among Asian Americans
The “immigrant paradox” describes the improved rates of mental health among immigrants compared to their native-born counterparts despite their lower socioeconomic status upon arrival (Alegría et al 2017). Data compiled about the Asian American sample from the National Epidemiological Survey of Alcohol and Related Conditions (NESARC) showed risk of psychiatric illness is significantly lower among foreign-born Asians relative to the US-born and the lowest for immigrants who arrived in the U.S. after age 14, followed by those who arrived prior to adolescence (Alegría et al 2017). Across all disorder classes, risk for first onset of illness was lowest prior to immigration, after which risk increased along with duration of stay until it was comparable with risks of the US-born (Alegría et al 2017). Foreign-born Asians also have a lower lifetime risk for substance abuse that increases with second and third generations (Alegría et al 2017).
However, factors such as low family cohesion, acculturative stress, younger age at immigration, neighborhood context (whether one resides with a high density of members of the same ethnicity or is exposed to more diverse groups) (Alegría et al 2017), and duration of stay (Breslau et al 2006) can all contribute to elevated risk of mental illness among Asian immigrants. DeVylder et al (2013) discovered evidence associating degree of integration into a new culture and encountered hostility/discrimination with variability in psychotic symptoms. In addition, a study conducted by Hawkins et al (2022) indicated isolation resulting from a lack of English-language proficiency, which prevents immigrants from participating in social activities, can lead to great emotional distress. Surveyed older Chinese immigrants felt like they were “in prison” despite living with their families due to few friends, shifting roles with children, and a “lack of belonging” (Hawkins et al 2022). Among individuals with language issues, psychiatric challenges (psychosis & impulse control) were found to be more common among Asian Americans than among White Americans (Hong et al 2023). An Adult Needs & Strength Assessment (ANSA), which surveys psycho-social factors to identify needs in individuals with mental health challenges, reported Asian Americans were significantly more likely to report functional needs related to cultural factors (e.g., identity, stress, language barriers, tradition) than White or Black Americans (Hong et al 2023).
Compared with other ethnic groups, Asian Americans have historically reported the lowest rates of mental health treatment and service utilization (Lee et al 2021), and despite rising discrimination during the COVID-19 pandemic, prevalence of poor mental health among Asian immigrants remains lower than that of Caucasian populations, with 16% of Asian adults reporting a mental illness compared to 24% of White adults (Artiga & Panchal 2023). This has been attributed to residence in close-knit immigrant communities (Alegría et. al. 2017) and higher levels of social engagement with family and friends (Hong et. al. 2023). However, another potential explanation for such historically low rates of psychiatric disorder, even more pronounced among immigrants than US-born Asian populations, is an unwillingness to seek medical diagnosis and treatment (Hong et al 2023). In an experiment conducted by Berry et al (2002) sampling Asian immigrants, 50% of participants expressed strong unwillingness to seek psychological treatment, and approximately 30% expressed strong unwillingness to recommend such treatments to distressed friends.
A number of factors contribute to their aversion to help; both social and internalized stigma can cause Asians to associate mental illnesses with the shame of being a burden to others and not meeting family obligations (Na et al 2016). East Asian immigrants tend to seek familial help or spiritual guidance rather than professional services and are less likely than Westerners to talk to anyone (Na et al 2016). Interestingly, some Asian languages have no words related to mental illness, while others (e.g. Korean, Japanese) rarely use terms for anxiety and depression (Wang et al 2019), indicating dismissal of mental health challenges. Structural barriers include mental health access costs, a lack of or unawareness of services, and language discrimination (Kim & Lee et al 2021), with immigrants whose English was not good being significantly less likely to receive treatment (Lee et al 2021). Finally, failure to recognize the need for psychological help hinders help-seeking for many first-generation Asian Americans, who often delay treatment-seeking until their symptoms are chronic or severe (Lee et al 2021).
On the other hand, over twenty studies have found that social support is an important counter to the risk of mental illness among adult immigrants, even when it was never the research hypothesis (Hawkins et al 2022). English language ability appears to be a key determinant for help-seeking, as those with a high proficiency in English are twice as likely to have obtained treatment in their lifetime, while those without were significantly less likely to do the same (Lee et al 2021). Berry et al (2002) also found a positive association between willingness to use services and age; Asians who immigrated before the age of 13 tend to show increased use of specialty mental health services (Lee et al 2021), whereas if one immigrates at an older age, they likely were exposed to adverse conditions in their country-of-origin for a longer period and/or have limited opportunities in the US for building socioeconomic resources such as savings (Hawkins et al 2022).
Motivation for the Current Study
While mental illness is a universal issue affecting all demographics and backgrounds, I intend to focus specifically on the experiences of Asian immigrants, and Asian Americans due to my personal relationship with, and proximity to these communities. My parents and I were first-generation Chinese immigrants in the late 2000s. My mother developed bipolar disorder early during her residence in the United States, which my family attributes to the stress of immigration and isolation from the rest of her family back home. Typical Chinese family structure enables close communication with, and support from a large extended family, besides regular community activities, and family reunions. Being a new immigrant in the US, my mother suffered the lack of support from family, and community, abruptly. She also rarely attended community activities in the US likely due to language barriers that also made her apprehensive to find help. Such lack of a support network and English fluency led her to refuse treatment for over a decade. As a first part to my interest in mental health issues, I will explore whether these issues can be observed in other immigrants of Asian origin as a result of similar obstacles to seeking out mental health services.
Method
We conducted a survey that was targeted to Asian immigrants and their families. The survey was sent to the first author’s network connections, to expedite data collection. The survey included multiple-choice and open-ended questions and is provided in Appendix 1. Participants were aged between 16 to 55 years old, and the majority were from the targeted Asian immigrant population.
Results
Demographics
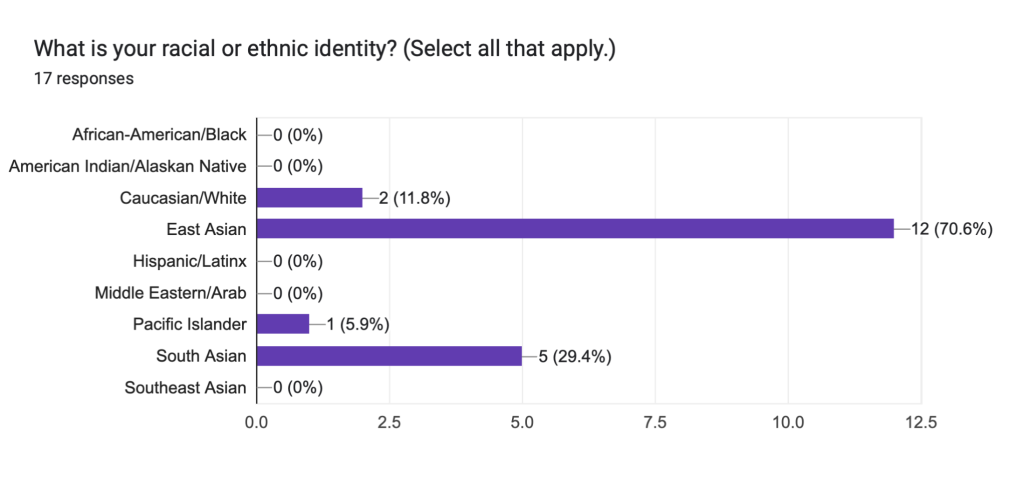
Racial/ethnic identity of participants
Of the 17 survey respondents, 58.8% were of East Asian descent and 29.4% were of South Asian descent. One participant was of mixed Caucasian/Asian descent, and another was of mixed Caucasian, Asian, and Pacific Islander descent. Both indicated their ethnic identity under multiple options.
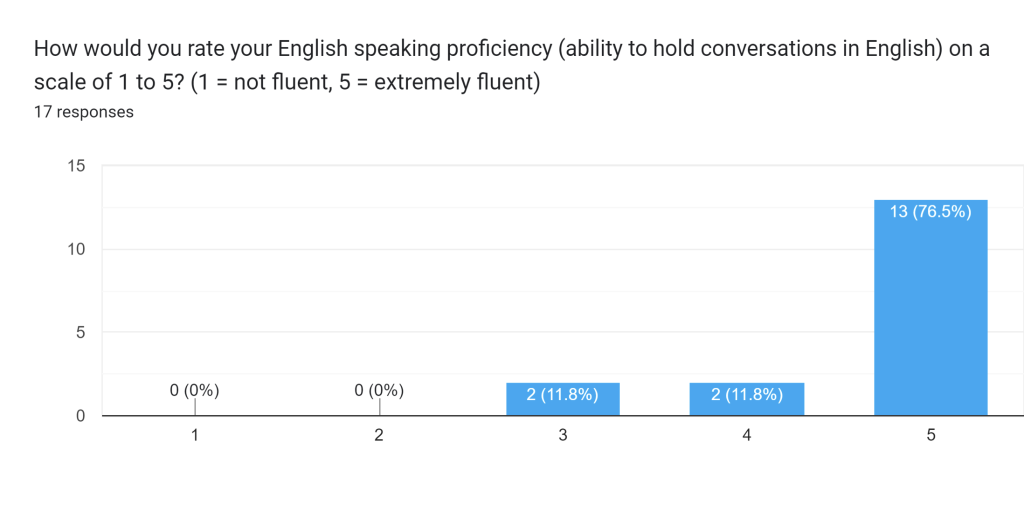
English-speaking proficiency
Of the 17 Asian (and biracial) respondents, 11.8% of respondents rated their English-speaking proficiency a 3 on a scale of 1 (not fluent) to 5 (fluent), 11.8% rated their English-speaking proficiency a 4, and 82.4% rated themselves a 5.
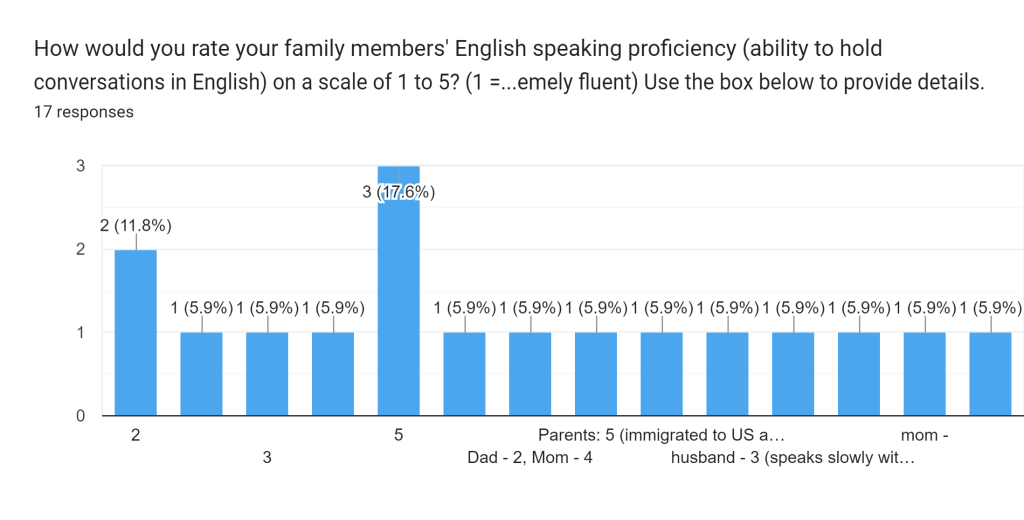
English-speaking proficiency of family members
Of the 17 Asian (and biracial) respondents, 17.6% of respondents rated the English fluency of their immediate family members a 2, 11.8% gave a rating of 3, 5.6% (1) gave a rating of 4, 33.3% (6) gave a rating of 5, 5.6% (1) gave an unfinished response, and 33.3% (5) rated each family member differently. Of those 5, 3 (16.7% of all respondents) rated the first-generation immigrants a 3 and their children a 5, 1 (5.6%) rated the first-generation immigrant a 4 and the second generation a 5, and 1 (5.6%) rated their father a 4 and their mother a 2.
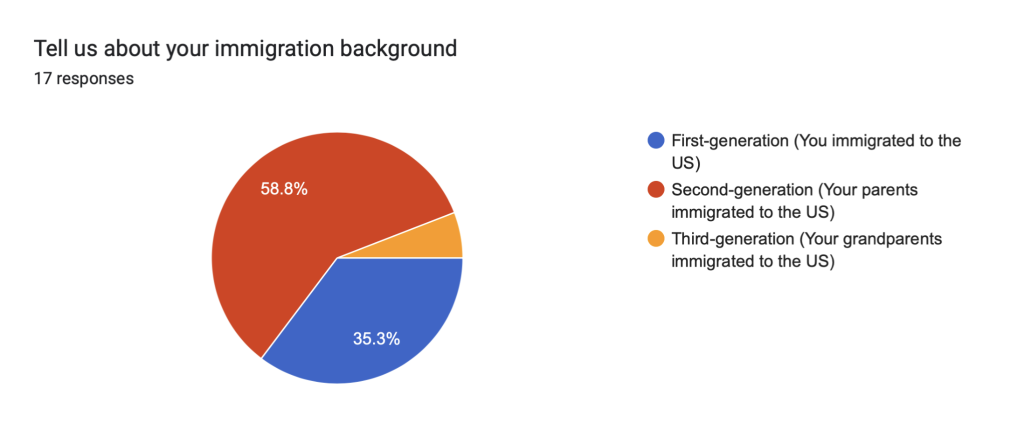
Immigration Background
Of the 17 Asian (and biracial) respondents, 58.8% of respondents indicated they were second-generation immigrants whose parents had settled in the United States, 35.3% were first-generation immigrants, and 5.9% (1) were third-generation immigrants whose grandparents first migrated.
Age of Immigration
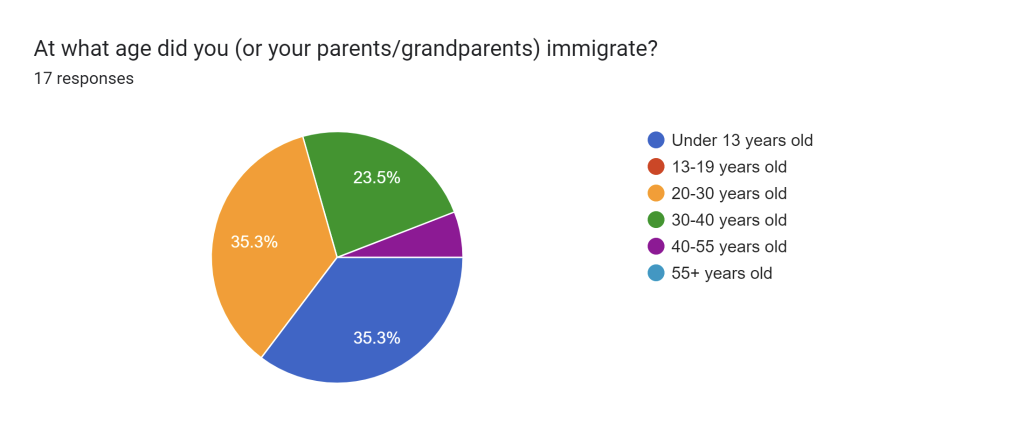
Of the 17 Asian (and biracial) respondents, 5.9% had parents who immigrated under the age of 13, 29.4% had parents who immigrated in the 20-30 years old range, 11.8% had parents who immigrated when they were 30-40 years old, and 5.9% had parents who immigrated when they were 40-55 years old. 29.4% (5) immigrated themselves under the age of 13, 5.9% immigrated at 20-30 years old, 11.8% immigrated at 30-40 years old.
Connectivity
Social connectivity within one’s own familial/cultural community
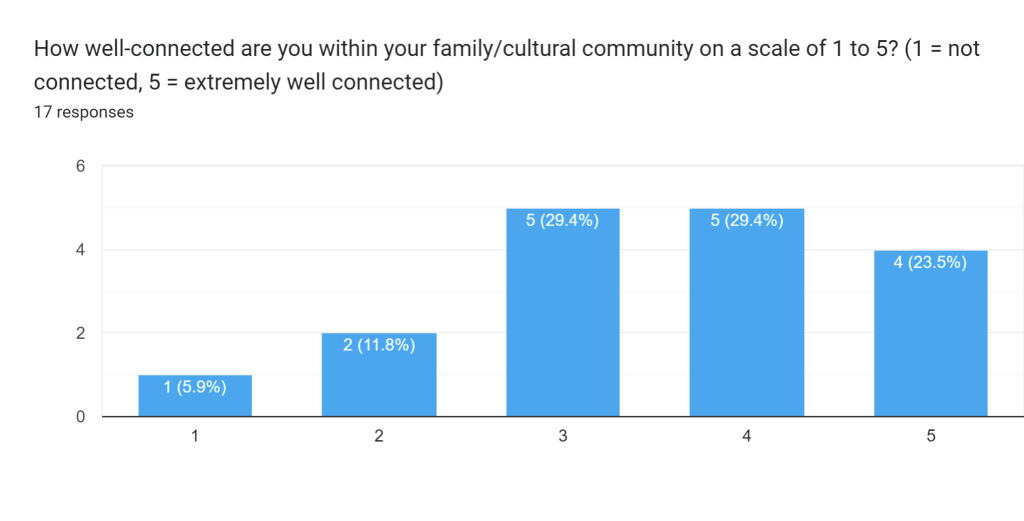
Of the 17 Asian (and biracial) respondents, 5.9% of respondents rated their connectivity within their family/cultural community 1 on a scale of one (not connected) to 5 (extremely well connected). 11.8% gave themselves a rating of 2, 29.4% gave themselves a rating of 3, 29.4% rated themselves a 4, and 23.5% rated themselves a 5.
Social connectivity of family members within their own familial/cultural community
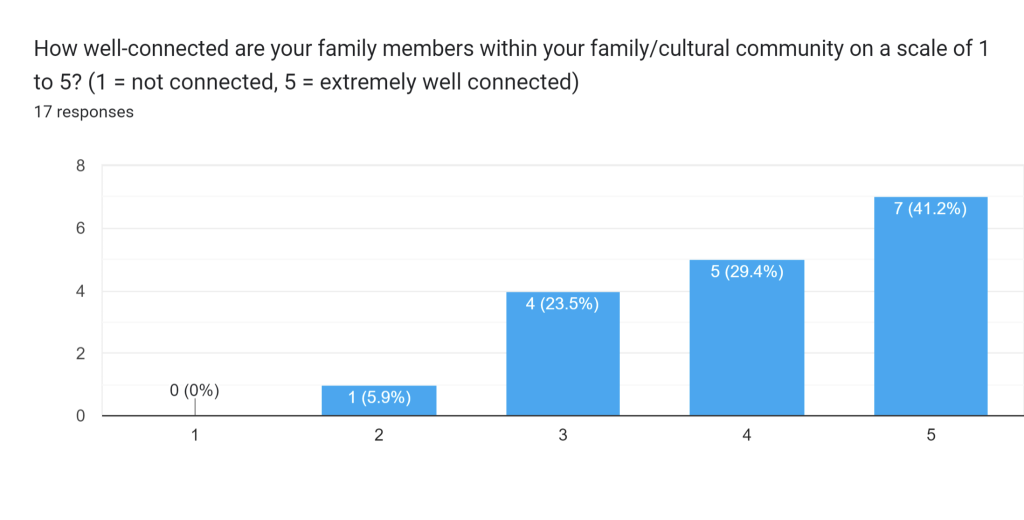
5.9% of respondents rated the social connectivity of their family members at 2, 23.5% gave a rating of 3, 29.4% gave a rating of 4, and 41.2% gave a rating of five.
Social connectivity within one’s own familial/cultural community
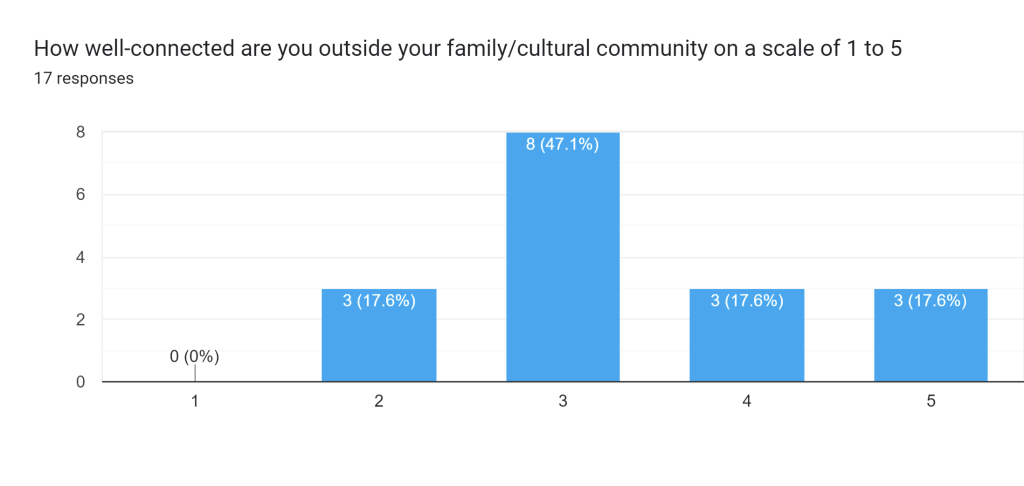
17.6% of respondents rated their connectivity outside their community a 2, 47.1% gave a rating of three, 17.6% gave a rating of four, and 17.6% gave a rating of five.
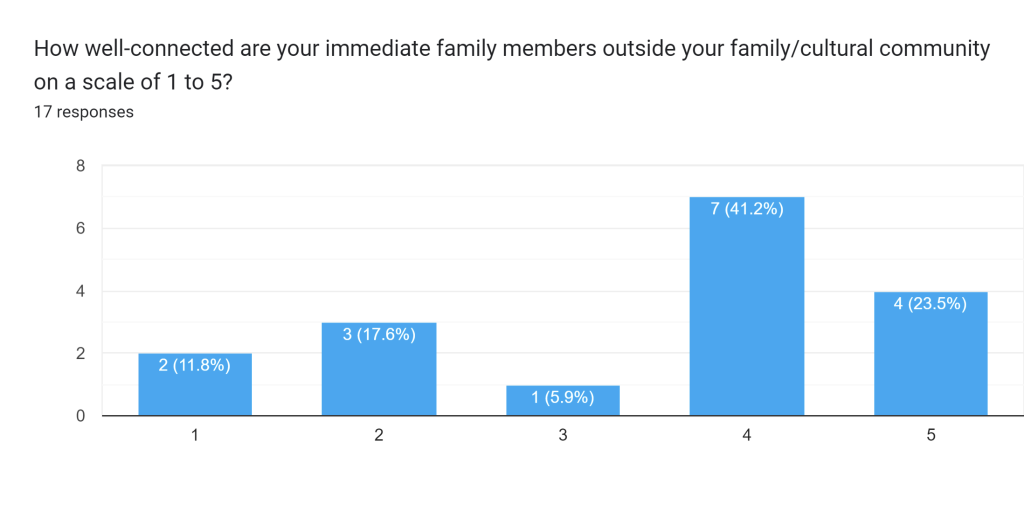
Social connectivity of family members outside their own familial/cultural community
11.8% of respondents raided the connectivity of their immediate family members outside their community a one, 17.6% gave a rating of two, 5.9% gave a rating of three, 41.2% gave a rating of four, and 23.5% gave a rating of five.
Mental Health Challenges
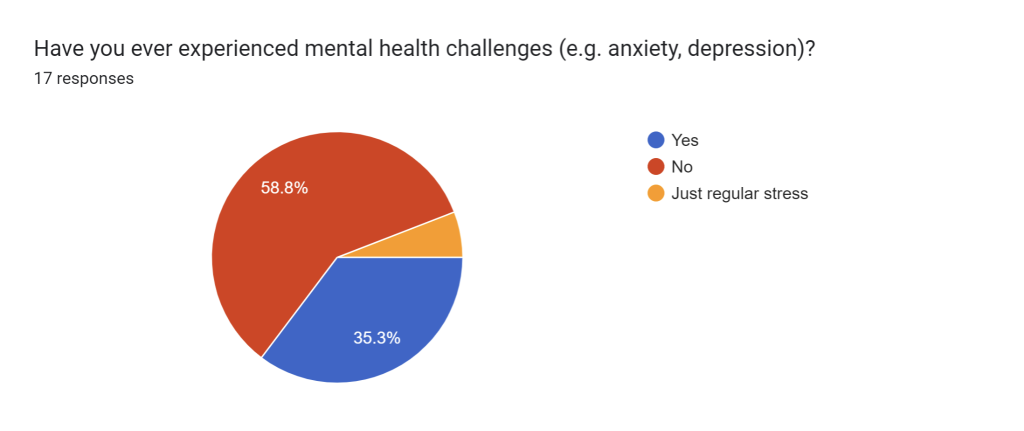
Have you ever experienced mental health challenges?
In response to a question of whether they have ever experienced mental health challenges, 58.8% of respondents answered “no”, 35.3% answered yes and 5.9% answered “just regular stress”.
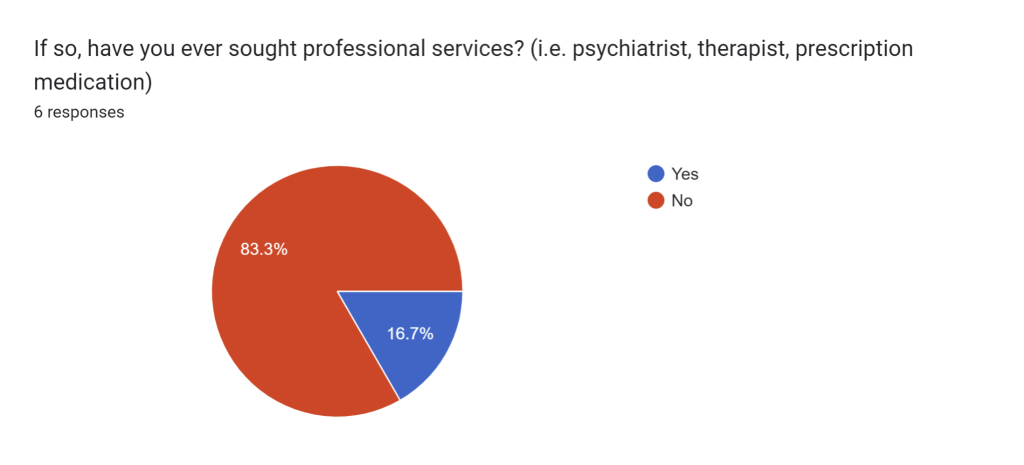
If so, have you ever sought professional services?
83.3% of respondents who experienced mental health challenges indicated they had never sought professional services, while 16.7% answered that they had.
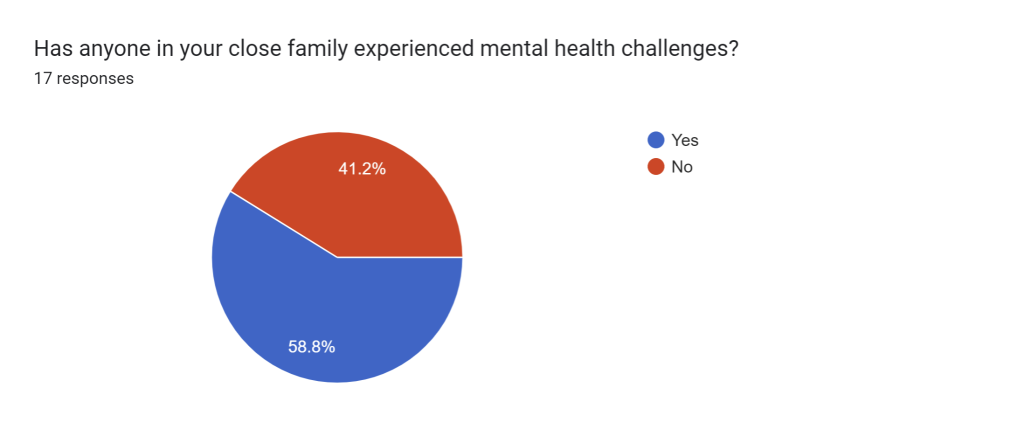
Has anyone in your close family experienced mental health challenges?
58.8% of respondents indicated someone in their close family had experienced mental health challenges, while 41.2% answered no.
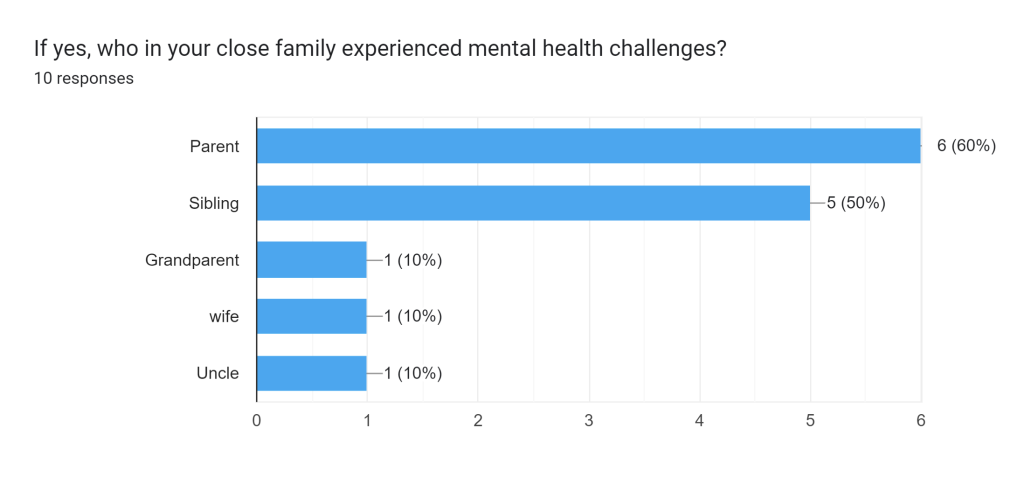
If yes, who in your close family experienced mental health challenges?
60% of respondents indicated a parent has experienced mental health challenges, 50% answered “a sibling”, 10% indicated a grandparent, 10% answered “a wife”, and 10% answered “an uncle”.
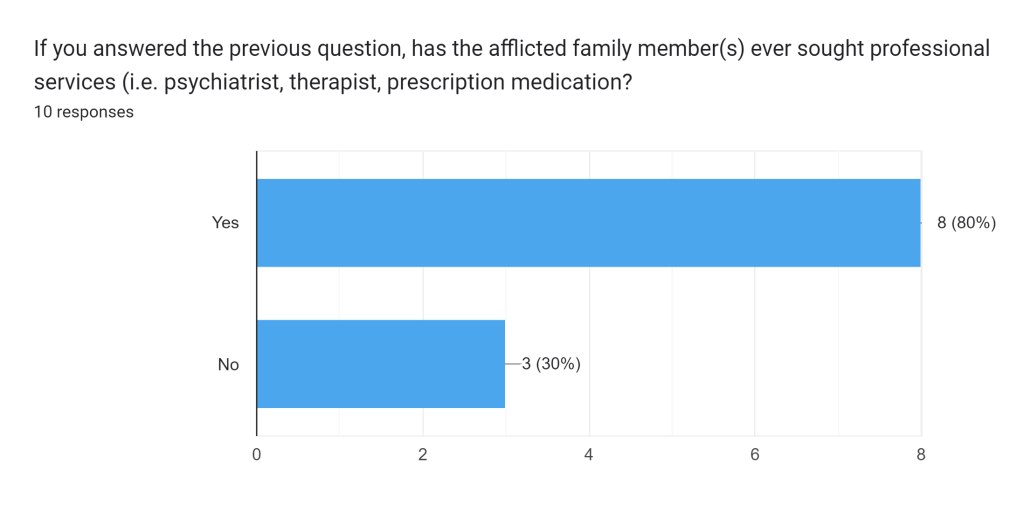
If you answer the previous question, has the afflicted family member ever sought professional services?
80% of respondents answered that their family members afflicted with mental health challenges had sought professional services, while 30% answered no.
Attitudes toward mental health
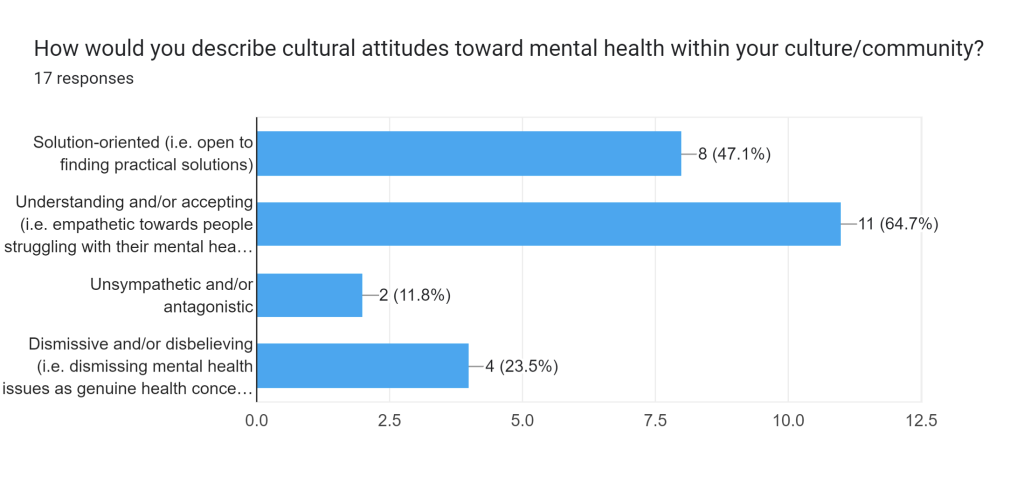
How would you describe cultural attitudes toward mental health in your culture/community?
47.1% indicated cultural attitudes toward mental health in their community were solution oriented, 64.7% described the perception of mental health as understanding and/or accepting, 11.8% answered unsympathetic and/or antagonistic, and 23.5% answered dismissive and/or disbelieving.
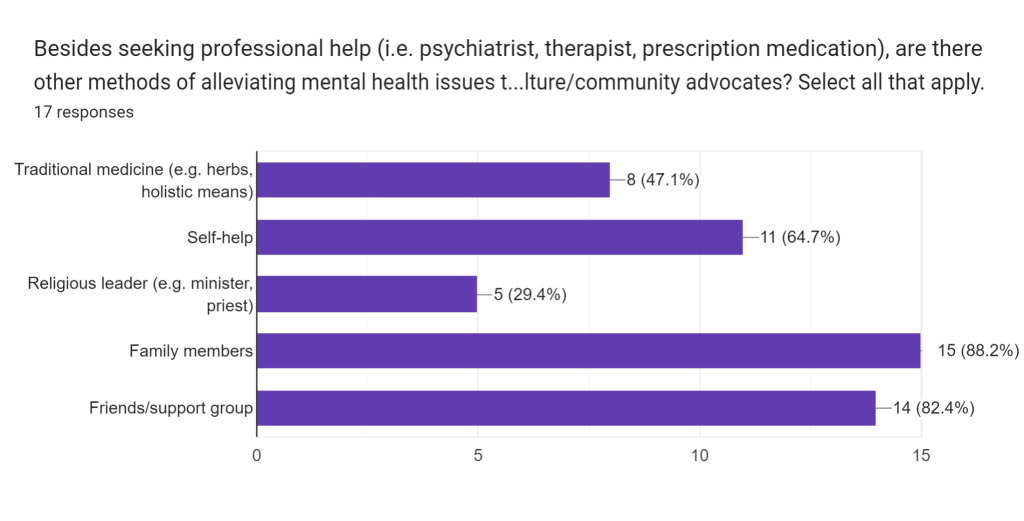
Besides professional services, what are other methods of alleviating mental health issues that your culture/community advocates?
47.1% of respondents indicated that their culture/community also advocates traditional medicine as a means of treating mental health, 64.7% answered self-help, 29.4% answered a religious leader, 83.3% indicated family members, and 77.8% indicated friends/support group.
Participants’ connections:
82.4% of participants indicated they were moderately- to well-connected with their family and cultural community (their rating for themselves = 3 or above). Figure 6 provides the frequencies of participants’ responses. Of these 14 participants, 78.6% (N=11) also indicated that they were moderately to well-connected outside their family/cultural community (rating = 3 or above).
Participants’ family’s connections:
94.1% of the participants said their family members were moderately- to well-connected with their family and cultural community (rating = 3 or above). Figure 7 provides the frequencies of participants’ responses. Of these 16 respondents, 75% also indicated that their family members were moderately to well-connected outside their family/cultural community.
Mental health among the participants
35.3% of the respondents reported experiencing mental health issues themselves, and of those respondents, only 16.7% stated they had sought professional help.
Of the 35.3% who has experienced psychiatric challenges, 100% rated their English-speaking proficiency a 5, 66.7% considered themselves moderately- to well-connected within their familial/cultural community (rating = 3 or above), and 83.3% considered themselves moderately- to well-connected outside their familial/cultural community. 50% described their culture as dismissive of mental health as a genuine health concern, 33.3% described their culture as unsympathetic toward psychiatric challenges, 33.3% described their culture as having an understanding attitude, and 33.3% described their culture as solution-oriented.
The sole respondent who indicated that they had sought professional help for their condition rated their English-speaking proficiency a 5, their connectivity within their family/cultural community a 1, and their connectivity outside their community a 3. They described attitudes toward mental illness within their immediate culture as unsympathetic/antagonistic and dismissive/disbelieving.
Mental health among the participants’ families
Of the 58.8% of respondents who answered that their family members had also experienced mental health issues, 60% said it was a parent who experienced mental health issues, 50% indicated a sibling, 10% indicated a spouse, 10% indicated an uncle, and 10% indicated a grandparent (several participants checked multiple answers in response to the question), and 80% answered that their family members had sought professional help.
Of the 58.8% with family members who have experienced psychiatric challenges, 80% rated their family members’ English-speaking proficiency a 3 or above (moderately good to extremely fluent), 90% considered their family members moderately- to well-connected within their own familial/cultural community (rating = 3 or above), and 60% considered their family members moderately- to well-connected outside their familial/cultural community. 30% described their culture as dismissive of mental health as a genuine health concern, 10% described their culture as unsympathetic toward psychiatric challenges, 50% described their culture as having an understanding attitude, and 50% described their culture as solution-oriented.
Among the 80% of those whose family members have experienced mental health issues who also indicated that their family members had sought professional help, 87.5% rated their family members moderately- to well-connected within their familial/cultural community, 50% rated them moderately- to well-connected outside their community, 75% rated their family members’ English-speaking proficiency a 3 or above, 12.5% described their culture as dismissive of mental health as a genuine health concern, 12.5% described their culture as unsympathetic toward psychiatric challenges, 50% described their culture as having an understanding attitude, and 62.5% described their culture as solution-oriented.
Conclusions
No strong correlation can be observed between respondents’ own mental health afflictions, their aversion to treatment, and their low English-speaking proficiency or lack of social connectivity. All those who reported experiencing mental health issues themselves, including those who indicated they had never sought professional treatment, rated their English-speaking proficiency a 5, and the majority indicated that they were moderately- to well-connected both within and outside their familial/cultural communities. However, the majority of those who experienced mental health challenges but did not seek professional treatment (60%) negatively described attitudes toward mental illness within their culture, answering that their community had a disbelieving/dismissive and/or unsympathetic/antagonistic view of mental illness.
No strong correlation can be found between between the mental health of respondents’ family members, their aversion treatment, and their low English-speaking proficiency or lack of social connectivity. The majority of respondents whose family members have experienced mental health challenges indicated their family members were moderately to extremely fluent in speaking English and moderately- to well-connected within their cultural community, and half of those respondents answered that their family members were also moderately- to well-connected outside their cultural community. However, the majority of responses from those whose family members had experienced mental health challenges and not sought professional services negatively described cultural attitudes toward mental illness as dismissive/disbelieving. The overwhelming majority of those whose family members had experienced mental illness and sought professional services positively described their culture’s attitudes toward mental health as either understanding/accepting and/or solution-oriented.
No definitive inference can be made from these results, as the survey was disseminated amongst volunteers and can be subject to bias. However, based on the responses, cultural attitudes toward mental illness seem to correlate the most with whether those afflicted with mental health seek professional services or not, depending on how positive or negative their community’s perception of mental illness is. English-speaking proficiency and social connectivity had little connection to whether participants developed mental illness or sought treatment.
Our next step is to refine this survey by randomly sampling audiences for a more unbiased, representative sample of the general Asian immigrant population in the United States, once we gain more resources. We would also like to collect information on substance abuse, a type of psychiatric disorder, and its pervasiveness among Asian immigrant populations to delve deeper into the nuances of mental health among the Asian American diaspora.
Appendix 1
Questions – convert to open ended survey questions with possible choices for selection:
- Racial/ethnic background:
- Caucasian,
- African American
- Hispanic/Latino
- Asian/Pacific Islander
- Arab/Middle Eastern
- Multiracial
- What is your immigration background?
- First-generation
- How old were you upon arrival?
- Second-generation
- How old were your parents upon arrival?
- How old were you?
- Third-generation
- Non-immigrant
- How would you rate your social network (within your family/cultural community and outside) on a scale of 1 to 5?
- 1 = least connected
- 2
- 3
- 4
- 5 = most connected
- How would you rate your family’s social connectivity (within and outside) on a scale of 1 to 5?
- 1
- 2
- 3
- 4
- 5
- Question on English speaking fluency (or how well you can converse in English) –
How would you rate your English speaking proficiency on a scale of 1 to 5?
- 1 = not proficient
- 2
- 3
- 4
- 5 = very fluent
- How would you rate the English speaking proficiency of your immediate family members on a scale of 1 to 5?
- 1
- 2
- 3
- 4
- 5
- Have you ever experienced mental illness in your life?
- Yes
- Have you ever sought professional treatment? (i.e. psychiatrist, therapist, prescription medication)
- Yes
- No
- Have you ever sought professional treatment? (i.e. psychiatrist, therapist, prescription medication)
- No
- Other
- If other, explain _____
- Yes
- Has anyone in your family ever experienced mental illness (e.g., depression, anxiety etc.)?
- If so, please indicate:
- A parent/guardian
- Have they ever sought professional treatment? (i.e. psychiatrist, therapist, prescription medication)
- Yes
- No
- Have they ever sought professional treatment? (i.e. psychiatrist, therapist, prescription medication)
- A sibling
- If yes, have you ever sought professional treatment? (i.e. psychiatrist, therapist, prescription medication)
- Yes
- No
- If yes, have you ever sought professional treatment? (i.e. psychiatrist, therapist, prescription medication)
- Grandparent
- If yes, have you ever sought professional treatment? (i.e. psychiatrist, therapist, prescription medication)
- Yes
- No
- If yes, have you ever sought professional treatment? (i.e. psychiatrist, therapist, prescription medication)
- Uncle/aunt
- If yes, have you ever sought professional treatment? (i.e. psychiatrist, therapist, prescription medication)
- Yes
- No
- If yes, have you ever sought professional treatment? (i.e. psychiatrist, therapist, prescription medication)
- Cousin
- If yes, have you ever sought professional treatment? (i.e. psychiatrist, therapist, prescription medication)
- Yes
- No
- If yes, have you ever sought professional treatment? (i.e. psychiatrist, therapist, prescription medication)
- Other ______
- If yes, have you ever sought professional treatment? (i.e. psychiatrist, therapist, prescription medication)
- Yes
- No
- If yes, have you ever sought professional treatment? (i.e. psychiatrist, therapist, prescription medication)
- A parent/guardian
- If so, please indicate:
- How would you describe cultural attitudes toward mental illness within your cultural community? Check all that apply:
- Solution-oriented (i.e., open to finding practical solutions)
- Understanding (being empathetic towards people struggling with mental issues)
- Accepting
- Dismissive
- Disbelieving
- Unsympathetic
- Antagonistic
- Other _______
- Besides seeking professional help, are there other methods of treating mental health your community advocates? Check all that apply:
- Traditional medicine (ex. Herbs, holistic measures)
- Self-help/self-navigation
- Religious leader (ex. Minister, priest)
- Family members
- Friends
- Other _______
References
Immigration to the USA and risk for mood and anxiety disorders: variation by origin and age at immigration (NLM)
Breslau J, Borges G, Hagar Y, Tancredi D, Gilman S. Immigration to the USA and risk for mood and anxiety disorders: variation by origin and age at immigration. Psychol Med. 2009 Jul;39(7):1117-27. doi: 10.1017/S0033291708004698. Epub 2008 Nov 12. PMID: 19000338; PMCID: PMC2748984.
Predicting the Behavioral Health Needs of Asian Americans in Public Mental Health Treatment: A Classification Tree Approach
Hong, S., Walton, B., Kim, H. W., & Rhee, T. G. (2023). Predicting the Behavioral Health Needs of Asian Americans in Public Mental Health Treatment: A Classification Tree Approach. Administration and policy in mental health, 50(4), 630–643. https://doi.org/10.1007/s10488-023-01266-x
Common Mental Health Problems in Immigrants and Refugees: general approach in primary care
Kirmayer, L. J., Narasiah, L., Munoz, M., Rashid, M., Ryder, A. G., Guzder, J., Hassan, G., Rousseau, C., & Pottie, K. (2011). Common mental health problems in immigrants and refugees: general approach in primary care. Canadian Medical Association Journal, 183(12), E959–E967. https://doi.org/10.1503/cmaj.090292
Mental Health Among Asian-Americans Nishi K. (2012). Mental Health Among Asian-Americans. American Psychological Association. https://www.apa.org/pi/oema/resources/ethnicity-health/asian-american/article-mental-health
Immigration and the Life Course: Contextualizing and Understanding Healthcare Access and Health of Older Adult Immigrants
Bacong AM, Đoàn LN. Immigration and the Life Course: Contextualizing and Understanding Healthcare Access and Health of Older Adult Immigrants. J Aging Health. 2022 Dec;34(9-10):1228-1243. doi: 10.1177/08982643221104931. Epub 2022 May 31. PMID: 35641140; PMCID: PMC9630965.
Factors Associated with Mental Health Help-Seeking Among Asian Americans: a Systematic Review
Kim SB, Lee YJ. Factors Associated with Mental Health Help-Seeking Among Asian Americans: a Systematic Review. J Racial Ethn Health Disparities. 2022 Aug;9(4):1276-1297. doi: 10.1007/s40615-021-01068-7. Epub 2021 Jun 1. PMID: 34076864; PMCID: PMC8170060.
Correlates of Mental Health Treatment Receipt Among Asian Americans with Perceived Mental Health Problems
Lee M, Bhimla A, Lu W, Ma GX. Correlates of Mental Health Treatment Receipt Among Asian Americans with Perceived Mental Health Problems. J Behav Health Serv Res. 2021 Apr;48(2):199-212. doi: 10.1007/s11414-020-09704-6. PMID: 32347427; PMCID: PMC7606267.
Immigration to the United States, 1851-1900
Library of Congress. (2023). Immigration to the United States, 1851-1900 | Rise of Industrial America, 1876-1900 | U.S. History Primary Source Timeline | Classroom Materials at the Library of Congress | Library of Congress. Library of Congress, Washington, D.C. 20540 USA. https://www.loc.gov/classroom-materials/united-states-history-primary-source-timeline/rise-of-industrial-america-1876-1900/immigration-to-united-states-1851-1900/
Asians and Asian Exclusion
Asians and Asian Exclusion. (n.d.). Pluralism.org. https://pluralism.org/asians-and-asian-exclusion
Asian and Pacific Islander Population in the United States
Asian and Pacific Islander Population in the United States. (2021, March 21). Web.archive.org. https://web.archive.org/web/20210321072211/https://www.census.gov/library/visualizations/2020/demo/aian-population.html
Growth and Inclusion
Library of Congress. (n.d.). Growth and Inclusion | Chinese | Immigration and Relocation in U.S. History | Classroom Materials at the Library of Congress | Library of Congress. Library of Congress, Washington, D.C. 20540 USA. https://www.loc.gov/classroom-materials/immigration/chinese/growth-and-inclusion/
Immigration and Mental Health
Alegría, M., Álvarez, K. & DiMarzio, K. Immigration and Mental Health. Curr Epidemiol Rep 4, 145–155 (2017). https://doi.org/10.1007/s40471-017-0111-2
Cultural, psychological, and demographic correlates of willingness to use psychological services among East Asian immigrants
Barry DT, Grilo CM. Cultural, psychological, and demographic correlates of willingness to use psychological services among East Asian immigrants. J Nerv Ment Dis. 2002 Jan;190(1):32-9. doi: 10.1097/00005053-200201000-00008. PMID: 11838029.
Barriers and facilitators of health among older adult immigrants in the United States: an integrative review of 20 years of literature
Hawkins MM, Holliday DD, Weinhardt LS, Florsheim P, Ngui E, AbuZahra T. Barriers and facilitators of health among older adult immigrants in the United States: an integrative review of 20 years of literature. BMC Public Health. 2022 Apr 14;22(1):755. doi: 10.1186/s12889-022-13042-x. PMID: 35421979; PMCID: PMC9008931.
Toward a Culturally Responsive Model of Mental Health Literacy: Facilitating Help-Seeking Among East Asian Immigrants to North America
Na S, Ryder AG, Kirmayer LJ. Toward a Culturally Responsive Model of Mental Health Literacy: Facilitating Help-Seeking Among East Asian Immigrants to North America. Am J Community Psychol. 2016 Sep;58(1-2):211-25. doi: 10.1002/ajcp.12085. Epub 2016 Sep 5. PMID: 27596560.
About the author
Gladys Cai
Gladys is currently a senior at Conestoga High School in Berwyn, Pennsylvania. Her favorite school subjects have always been social studies and math, and her favorite high school courses have been Psychology, Statistics, and World History. Outside of the classroom, Gladys likes to volunteer at local community events and play tennis on the weekends.