Author: Yicheng (Ethan) Ding
Mentor: Dr. Vincent Boudreau, UC Berkeley
Shanghai Pinghe Bilingual School
October 1, 2021
Abstract
As an innovative way to target B cell malignancies, the chimeric antigen receptors (CARs) therapy uses patient’s cells and reengineers them with a T cell receptor, enabling them to identify CD-19 antigens and eliminate tumors. However, the problem of cytotoxicity and tumor relapse exists within the CARs therapies. To address these limitations, a new generation of CARs, T cell receptor fusion constructs (TRuCs), to treat cancer diseases have been developed. Unlike CAR-T cells, which do not integrate anti-CD19 as part of T cell receptor (TCR), TRuC-T cells incorporates fusion constructs into functional T cell receptors. Using quantitative techniques such as Fluorescence-activated cell sorting (FACS) and Blue native PAGE, researchers have reported that TRuC-T cells exhibit higher levels of activated signaling proteins compared with CAR-T cells. In both vitro and in vivo models, TRuC-T cells showed a higher efficacy than CAR-T cells in killing lymphoma and leukemia tumors. They also showed a significantly lower level of cytokine release and lower risk of tumor relapse after the treatment than CARs. As a new generation of cancer treatments, TRuC-T cells carry the prospect of treating diseases in an efficacious way with fewer side effects.
Keywords: cancer cells, tumor cells, the chimeric antigen receptors (CARs), T cell receptor fusion constructs (TRuCs),
Introduction
Cancer, a disease that involves abnormal cell growth through uncontrolled mitosis and with the potential to invade to other parts of the body, is one of the most deleterious and dangerous threats to people’s physical health. Propagating in all parts of the human body such as the lymph system as regular cells need to divide through mitosis, cancer cells cause detrimental effects by keeping old cells from dying and interfering with daughter cell functioning. In 2018, there was an estimated 18.1 million new cancer cases diagnosed and 9.5 million cancer deaths around the globe (National Cancer Institute, 2020). Indeed, the number of cases and deaths are expected to rise to 29.5 million and 16.4 million by 2040, which call for a strong need for immunologists and biochemists to work out a better therapeutic solution. In August 2017, CAR (chimeric antigen receptor) therapy, which reprograms the immune system by engineering the T-cell receptor and targeting CD19 on the surface of cancer cells, first demonstrated impressive response to aggressive lymphomas. However, it has been accompanied by seriously harmful side effects such as cytokine release syndrome (CRS) and neurotoxicity. A considerable proportion of patients treated with CARs also relapsed.
Here, I discuss the development of the TRuC-T cells (TCR Fusion Construct T cells), their unique design and their high efficacy in the treatment of B cell malignancies. TRuC-T cells entered the clinic in 2018, killing tumor cells more efficaciously than CAR-T cells but with a significantly lower level of cytokine production. In addition, they exhibit potent anti-tumor activity in both liquid and solid cancer models, while the response seen in solid tumors from CAR-T cell therapy are less robust. This paper will discuss the effect of TRuC-T cells on cancer therapy in the following parts: TCR design, TCR composition, TCR efficacy in vitro, TCR activation, and TCR efficacy in vivo. The research on TRuC-T cells has a prominent significance in exploring current ways to cure cancer diseases and contributing to the improvement of people’s health all over the world.
Design of TRuC

T cell receptor fusion constructs effectively attach anti-CD19 to TCR complexes enabling them to recognize tumor surface antigens (Baeuerle, 2019). As shown in figure 1, there are four essential parts in TRuCs: EF1α, anti-CD19, TCR subunits, and GFP, between which linker and signal peptides connect individual domains. EF1α acts as a transcriptional promotor to enhance TRuC protein production. Anti-CD19 comprises two low and high domains which target antigen CD19 and induce immune response in the body. They are interconnected with G4S (G-quadruplex secondary structures) that allows fusion protein flexibility and also allows domains to come together. In TCR subunits, ECD, TM, and ICD respectively represent extracellular domain, transmembrane domain, and intracellular domain, all of which contributes to the activation of T cells in response to CD19. T2A is the cleavage site where GFP is cleaved and detected as a sign of successful TRuC activation.

To test TRuC assembly on individual TCR subunits, anti-CD19 was attached to each TCR subunit. There are five different kinds of TRuC: TCRα, TCRβ, CD3γ, CD3δ, and CD3ε. “All subunits are type I membrane proteins but CD3ζ have extracellular immunoglobulin (Ig) domains” (Baeuerle, 2019). Changes in the arrangement of anti-CD19 can regulate the activity of TCR not only in surface expression but also in function. Of note, two scFv (single-chain variable fragment) are fused to CD3ε while only one scFv is fused to other units in TCR, which affect the efficacy of TRuCs and will be discussed in the following sections.

The researchers use the technology FACS (Fluorescence-activated cell sorting) to show the expression of all five TRuC variants, and of 28ζ CAR, BBζ CAR, and linked GFP. It measures the shape and size of the cell and quantifies surface molecules and fluorescence. The y-axis represents anti-F(ab’)2 antibody recognizing the murine scFv framework. The x-axis represents GFP, which makes sure that the engineered genes work and indicates whether the TRuC protein is at the cell surface. Higher GFP amounts indicates that the engineered TRuC DNA constructs are being expressed in destination cells. As shown in figure 1c, the ε-TRuC exhibits the highest proportion 83% of T cells with anti-F(ab’)2 and GFP among five TRuCs. The other four vary greatly between 9% and 57%, which reflects the differences in efficiency of different scFv fused onto the TCR. As the second generation of CAR-T cells, BBζ CAR express a higher proportion on the T cell surface than any individual TRuC. Yet 28ζ CAR exhibit a lower expression than most TRuCs.

Consistent with FACS analysis, ε-TRuC and BBζ CAR have the highest F(ab’)2 mean fluorescent intensity compared with other signaling units. However, a big difference in MFI occurs in two individual donors despite the fact that both of them are inserted into the same T cell receptor. This means that there are discrepancies between individuals, so TRuCs and CARs will have different expression levels in different individuals. Another point worth noting is the vector control in this graph: without the scFv units fused to the TRuC or CAR, the F(ab’)2 MFI are still in a high amount, which reveals that the signaling units TCRα, TCRβ, CD3γ, CD3δ may not be helpful to enhance the mean fluorescent intensity. Additionally, the scale of the data is a bit unclear because there are far more numbers between 1000 and 10000 than that between 10 and 100. It is inappropriate to put them together as causing confusion.
TCR composition

After the incorporation of TRuCs, cells were lysed and TCR complexes were separated by Blue native PAGE. They were stained using an anti-CD3ζ antibody. “0” denotes the natural TCR complex, “1” and “2” denote TCR complexes with one or two TRuCs, respectively (Baeuerle, 2019). Blue native PAGE is a technique used for isolation of protein complexes and measurement of native protein masses without protein complex denaturation. In Figure 2a, the y-axis represents the measure of molecular weight or mass in kDa (kilodalton). Some are natural T cell receptor, while others are engineered TRuC receptor. The minimum mass of protein of natural TCR complex is 440 kDa. There is a direct correlation between the quantity of protein and how dark it is. According to the extent of stain darkness, the TCR complex with two α-TRuCs has the highest molecular mass with protein complexes measuring 660 kDa. Following close are TCR complexes with ε-TRuCs and β-TRuCs. Interestingly, natural vector control has a higher amount of protein than the cell with δ-TRuCs.

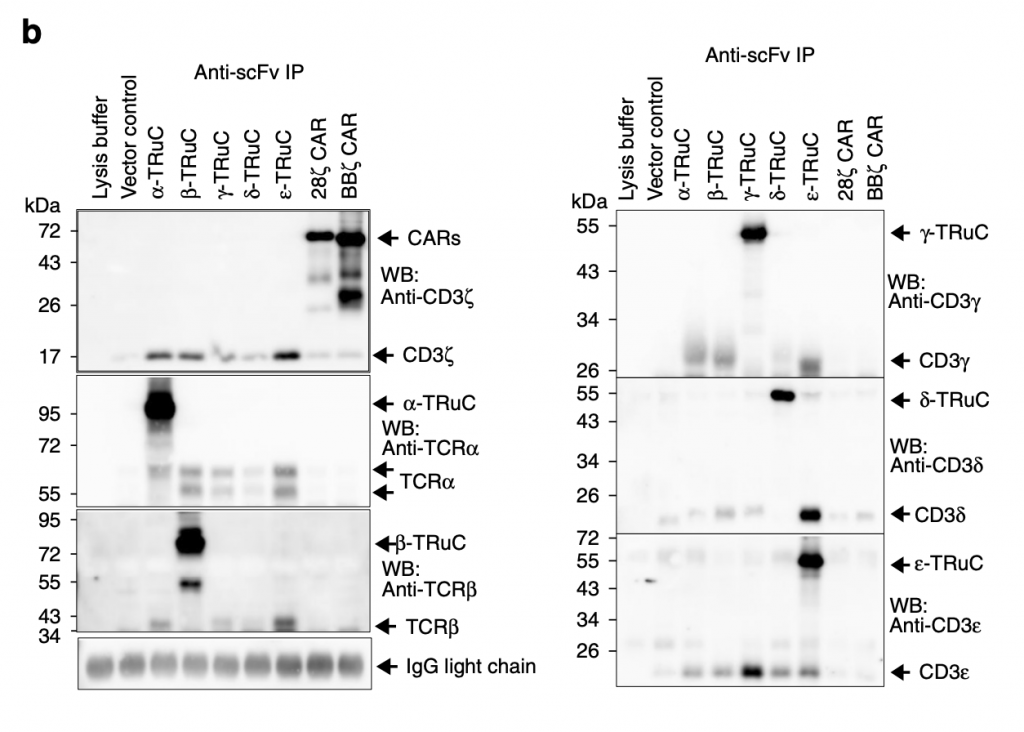
Researchers then used immunoprecipitation to show the amount of individual TRuC proteins in TCRs. “They were immunopurified using the anti-F(ab’)2 antibody, and then separated by reducing SDS-PAGE. (Co)-purified proteins were detected using the described antibodies by western blot” (Baeuerle, 2019). Different from figure 2a, TRuC variants here have similar amounts of protein and use different specific antibodies. For α-TRuC, they use corresponding anti-TCRα to show its molecular size 95 kDa. For β-TRuC, they use anti-TCRβ and identify its size as 80 kDa. For 28ζ and BBζ CAR-T cells, they both use anti-CD3ζ to show it size at 72 kDa. The overall result is that each TRuC and CAR shows its expected molecular size.

What researchers do next is to test the function of the T-cell receptor, which determines their sensitivity to different amounts of peptides. The higher mean fluorescent intensity it has, the more sensitive the T cell is. If TRuC or CAR T cells are too sensitive, they will be activated without any stimulation and be always on, which will finally lead to the self-destruction of the T cell. As shown in figure 2c, the MFI increases as the H-A peptide amount increases, indicating that they are becoming more active. It is worth noting that both of the CARs are easily activated, probably due to its strong tonic signaling. Also, the ε-TRuC exhibits equal mean fluorescent intensity with the vector control, meaning that TRuCs do not interfere with normal TCR function, while CARs impair a lot through increasing sensitivity.
TCR efficacy in vitro

To test the TRuC and CAR efficacy, researchers use two approaches: one was by percent lysis of luciferase-expressing Nalm6 cells after 24 h; the other was by means of an impedance-based assay using CD19-expressing HeLa cells to study the kinetics of cell lysis (Baeuerle, 2019). Luciferase is a bioluminescent enzyme, which in this case serves as reporter of successful lysis. Fig. 3a represents the tumor cell lysis of luciferase-expressing Nalm6 cells. The three blue dots are the biological replicates and means of the lysis percent. Error bars are also included in the graph. It is easy to see that there are stark differences in the lysis percent between vector control and two TCRs. The vector control only lyses about ten percent of tumor cells, while the most effective TCR, BBζ CAR-T cells, exhibits 65% tumor cell lysis. Among the TRuCs, the ε-TRuC demonstrates the highest tumor cell lysis, with 60% cell lysis. α-TRuC’s efficacy in tumor cell lysis is less robust than the other TRuC subunits, with 25% lysis.

As mentioned in the previous paragraph, this is the other approach that uses CD19-expressing HeLa cells to study cell lysis. HeLa cells are tumor cells, which are represented on the y-axis as normalized cells. After T cells were added, the tumor cell index decreased quickly and finally declined to zero after 120 hours. The fact that normalized cell index increased for vector control and cells without T cells insertion demonstrates the effectiveness of TRuC and CAR to lyse tumor cells. Among all TCRs, the most efficacious was BBζ CAR-T cells, in accordance with the result in tumor cell lysis using luciferase. The one with slowest rate of decreasing normalized cell index was β-TRuC.

Researchers selected three TCRs, ε-TRuC, 28ζ CAR, BBζ CAR, to examine the donor variability in tumor cell killing. It is clearly shown in fig.3c that donor variability only slightly affected the efficacy of TCRs in decreasing normalized cell index. All three patients’ normalized cell index successfully declined to zero after 120 hours. The cytokine release after the T cell adding and treatment is discussed in the next part.

Accompanied with T-cell treatment are cytokine production and secretion. One of the most harmful side effects of CAR-T cells is the cytokine release syndrome (CRS), which is further illustrated in these graphs. Compared with TRuCs, CARs release far more IL-2, IFNγ, IL-4, IL-13, and TNFα cytokines. Specifically for IL-2, when no TCRs are added, no cytokine release was observed. After the incorporation of γ-TRuC and ε-TRuC, there are approximately 4000 to 5000 pg IL-2 release, while after 28ζ CAR was inserted into the cell, the cytokine release was about 22000 pg. Thus, smaller amount of cytokine release is one of the advantages TRuC receptors have over CAR-T cell receptors, which prevents patients from suffering from neurotoxicity and other diseases.
TCR activation and signaling

The researchers then investigated on the activation of T-cell receptors by quantifying the amounts of CD69+ and CD25+ using FACS. The distribution of these two positive cell surface molecules, shown in fig. 4a, corresponds to the percentages of T-cell activation. ε-TRuC had the most significant amount of signaling among all TRuCs, displaying similar activation levels to BBζ CAR. Both ε-TRuC and BBζ CAR had 65% of CD69+ and CD25+ signaling, while that of α, β, δ-TRuC were much lower, exhibiting activation between 20 to 30%. Overall, both TRuCs and CARs showed less expression of CD69+ upon activation, but comparatively higher expression of CD25+, possibly due to their different TCR units.

Researchers then looked for the phosphorylation of intracellular signaling proteins and found that both CAR-T and TRuC-T cells induce intracellular signaling protein phosphorylation, but to different extents. They co-cultured T cells with CD19+ Raji cells at a 10:1 effector-to-target ratio for 30 min (Baeuerle, 2019). The phosphorylation of intracellular signaling proteins upon activation induced a change in charge, in turn causing a conformational change. The y-axis represents mean fluorescent intensity, which was used for detecting the amount of signaling per cell. For phosphorylation of CD3ε, the TRuCs displayed more than double the phosphorylation than the CARs. While for phosphorylation of LAT (Linker for activation of T cells) was an order of magnitude lesser, the signaling of TRuCs and CARs was measured and indicated that intercellular signaling is activated in both TRuCs and CARs upon stimulation.
Using FACS again, the graph shows T cells in GFP and phosphor-CD3ζ after 5 days expansion in the presence of IL-2 and anti-CD3/anti-CD28-coupled Dynabeads (Baeuerle, 2019). ε-TRuC had low levels of activated phosphor-CD3ζ, while the two CARs had slightly higher activation, while all their GFP amounts displayed 46.7%. In summary, TRuC-T cells and CAR-T cells had differing intracellular activation and signaling events.
TCR efficacy in vivo

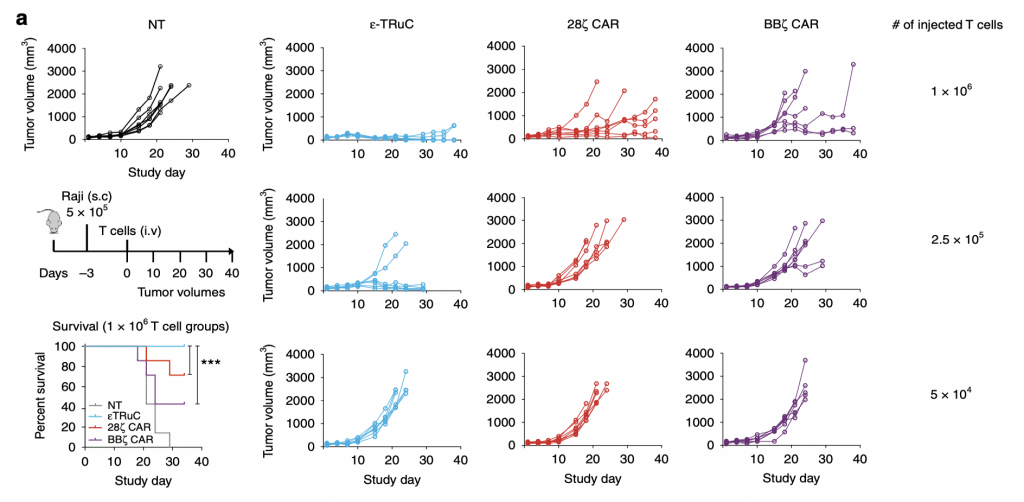
To test the anti-tumor activity of TCRs in liquid tumor model, researchers subcutaneously inoculated lymphoma and leukemia cells into mice. After the tumor cells began to grow in mice, they injected them with TRuC-T cells and CAR-T cells to treat them and test the efficacy of killing tumor cells. There was also a group of non-transduced mice used as a negative control. In NT group, the tumor volume increased in an exponential way: it nearly quadrupled after 20 days and kept increasing as the study progressed. However, the situation turned way much better when T cells were present. For ε-TRuC, when 1×10⁸ T cells were injected, the tumor volume kept close to zero and no tumor could be detected at the end of the study. While when 1×10⁸ CAR-T cells were injected into the mice, the tumor volume increased slowly. Thus, TRuC-T cells are more effective than CAR-T cells at killing tumor cells in vivo. Another advantage TRuC-T cells displayed was that the survival rates of mice after injecting them were almost 100%, while 20 to 30% of mice injected with CARs die after 20-30 days, highlighting the cytotoxic effects of CAR-T cell therapies. Also, as the number of injected T cells was decreased, the effectiveness of tumor cell elimination decreased as well: when 5×10⁴ T cells were injected, neither TRuC nor CAR could reduce the tumor volume over 40 days.

Immunocompromised NSG mice were injected with 5 × 10⁵ Raji-LUC cells into the tail vein of mice 5 days prior to treatment with 1 × 10⁷ non-transduced or engineered T cells (Baeuerle, 2019). For ε-TRuC, the luminescence rose, then decreased, and finally stayed constant, corresponding with its tumor volume in fig. 5a. The two CAR-T cells’ luminescence increases more than with TRuC: although it decreased at first, it then relapsed quickly, meaning that the tumor grew post treatment in CAR-treated mice.

In the end, researchers wanted to investigate the effectiveness of TRuC-T cells against solid tumor models. They focused on specific domain for BCMA (B cell maturation antigen) and IL13Rα2 (interleukin-13 receptor α2). As shown in fig. 6a, almost 100% of tumor cells are lysed and the tumor growth is inhibited no matter what kind of TRuC was fused with BCMA. For HeLa-CD19, the TRuCs had a low effect in tumor cell lysis, having small difference with the vector control.

RMPI 8226 is another multiple myeloma cell line, which is used here to test its anti-tumor activity. ε-TRuC, γ-TRuC, and β-TRuC successfully reduced tumor volume to zero after 40 days. However, the experiment cannot assure that the tumor may relapse after these 40 days.

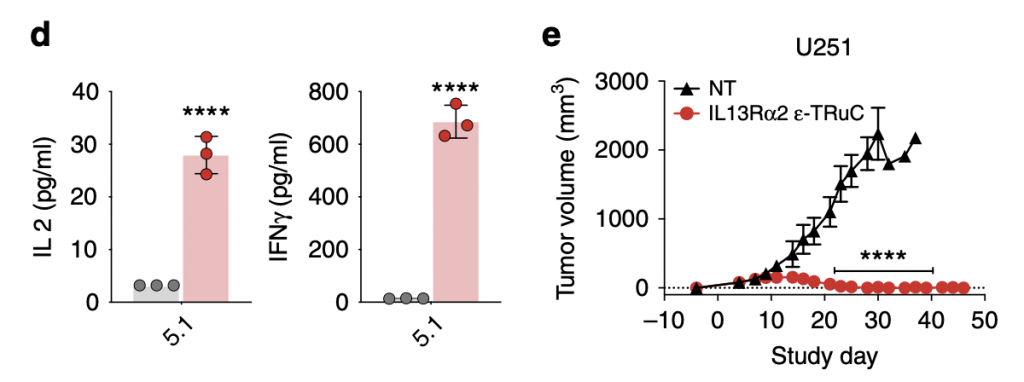
Researchers lysed U251 glioblastoma cells using IL-13Rα2-specific ε-TRuC-T cells at various effector-to-target ratios. When the effector-to-target ratio was larger, the percentage of tumor lysis tended to increase. In fig.6a, the effector-to-target ratio was 1:1 and had near 100% tumor cell lysis. By contrast, when the ratio was 1:1 in IL-13Rα2, the tumor cell lysis was only 35%. This shows that IL-13Rα2-specific TRuC cells are less efficient than BCMA TRuC cells in inducing tumor cell lysis, despite having similar effects on tumor growth.

As TRuC-T cells were shown to have efficacious tumor cell lysis effects and anti-tumor activity, they also released cytokines IL-2 and IFN- γ. Comparatively, the cytokine IFN- γ was released at higher levels than that of IL-2, about 20 times, but the unit is pg/mL, so the amount was actually lower than that released by CAR-T cells. The question of relapse is answered in the graph on the right: after 40 days, the tumor volume kept constant at zero and the trend suggested that their effects would be continual rather than only for a period of days,
Conclusion
TRuC-T cells are a generation of more effective CAR-T cell therapies that use fusion constructs to incorporate anti-CD19 into functional T cell receptors, as opposed to using chimeric T cell receptors. They are effective in vitro, as well as in vivo towards both liquid and solid tumors. TRuCs induce roughly half the amount of cytokine release compared to CAR-T cells and present a new generation of engineered T-cell receptor anti-cancer therapies, with promising efficacy and a lower risk of cytokine release syndrome (CRS). The research on TRuC-T cells plays a significant role in exploring current ways to combat cancer diseases improving people’s health all over the globe.
Bibliography
“Cancer Statistics.” National Cancer Institute, www.cancer.gov/about-cancer/understanding/statistics.
Baeuerle, Patrick A., et al. “Synthetic TRuC receptors engaging the complete T cell receptor for potent anti-tumor response.” Nature communications 10.1 (2019): 1-12.
About the author

Yicheng (Ethan) Ding
Yicheng is strongly interested in biology, especially molecular biology related to human bodies, such as proteins, DNA, and tumors. This inspiration is obtained partly due to the COVID-19 pandemic, which raises our concern and his want to improve human disease treatments. In his spare time, Ethan usually plays table tennis and plays basketball with friends, as well as watching TV programs such as the Big Bang theory.
